I don’t know if I used a VPS host with a high configuration before, or if there is a problem with the performance of the newly moved Alibaba Cloud Hong Kong VPS host. In short, every time I dig the site at night, the host becomes unstable and the system load suddenly becomes high. suddenly low. Using server log analysis tools: ngxtop and GoAccess, you can also find out that some IPs are constantly scanning server ports and WP background.
However, the most puzzling thing is that after entering the WP background, I opened more than a dozen pages at the same time with a browser, and used the Top command to track the VPS system load in real time, and found that the load increased in a straight line, from a few tenths of the original level. to 3 or more. Then, you will find that website access slows down and responses are delayed. This simply makes me wonder if I bought a fake Alibaba Cloud VPS host.
If you have encountered the same problem as me, you can try to follow the Linux system monitoring commands introduced in this article to make a comprehensive "CPU, memory, disk IO, network card traffic, system processes, port occupancy, etc." of your VPS host. experience”. VPS hosts are really worth every penny. Cheap VPS hosts are really not suitable for running dynamic programs such as WordPress.
For more Linux VPS utility tools, you can also try:
- Linux VPS mounts Google Drive and Dropbox-realizes VPS host data synchronization and backup
- Three free tools to help you detect the authenticity of VPS servers - VPS host performance and speed test methods
- WordPress comment WeChat notification and email reminder-Server sauce and third-party SMTP email
This article is divided into two parts: If you already know how to use a certain monitoring command, you can quickly search it directly in the Linux system monitoring command quick reference manual. There is a search box in the upper right corner of the table. You can enter it to quickly search. Function or command you want. If you are not familiar with a certain command, you can use the Chrome browser's web page viewing function shortcut key: ctrl+f, and enter the command to jump directly to the details section.

PS: Updated on April 14, 2018, Linux also has a very useful command Crontab, which is used to execute tasks regularly. Reference: Basic syntax and operation tutorial of Linux Crontab command scheduled tasks-VPS/Server Automation.
Zero, Linux system monitoring command quick reference manual
| Order | function | Usage examples |
|---|---|---|
| free | View memory usage, including physical memory and virtual memory | free -h or free -m |
| vmstat | Provides statistics on the overall system, including statistics on kernel processes, virtual memory, disks, traps, and CPU activity. | vmstat 2 100 |
| top | Real-time display of resource usage and overall status of each process in the system | top |
| mpstat | Real-time system monitoring tool that reports CPU-related statistics | mpstat |
| sar | Collect, report and save CPU, memory, input and output port usage | sar -n DEV 3 100 |
| netstat | Check the network connection of each port of the machine to display statistics related to IP, TCP, UDP and ICMP protocols | netstat -a |
| tcpdump | Used to capture or filter TCP/IP packets received or transmitted on a specified interface on the network | tcpdump -i eth0 -c 3 |
| IPTraf | Used to generate statistical data including TCP information, UDP counts, ICMP and OSPF information, Ethernet load information, node status information, IP checksum errors, etc. | iptraf |
| place | Check the disk space usage of Linux file system | df-h |
| iostat | Collect and display system storage device input and output status statistics | iostat -x -k 2 100 |
| iotop | Top tools for monitoring disk I/O usage | iotop |
| lsof | Used to display all open files and processes in list form | lsof |
| atop | What is shown is a combination of various system resources (CPU, memory, network, I/O, kernel), and is colored under high load conditions. | atop |
| htop | It is very similar to the top command, an advanced interactive real-time Linux process monitoring tool. | htop |
| P.S. | The most basic but also very powerful process viewing command | ps aux |
| glances | Monitor CPU, load average, memory, network traffic, disk I/O, other processors and file system space utilization | glances |
| dstat | An all-in-one system information statistics tool that can be used to replace vmstat, iostat, netstat, nfsstat and ifstat commands. | dstat |
| uptime | Used to check how long the server has been running and how many users are logged in, and to quickly learn the load of the server. | uptime |
| dmesg | Mainly used to display kernel information. Use dmesg to effectively diagnose machine hardware failures or add hardware problems. | dmesg |
| mpstat | Used to report the activity of each CPU of a multi-channel CPU host, as well as the CPU status of the entire host. | mpstat 2 3 |
| nmon | Monitor CPU, memory, I/O, file system and network resources. For memory usage, it can display total/remaining memory, swap space and other information in real time. | nmon |
| mytop | Used to monitor threads and performance of mysql. It gives you a real-time view of your database and what queries are being processed. | mytop |
| iftop | Used to monitor the real-time traffic of the network card (can specify the network segment), reverse IP resolution, display port information, etc. | iftop |
| jnettop | Monitor network traffic in the same way but more visually than iftop. It also supports customized text output and can deeply analyze logs in a friendly and interactive way. | jnettop |
| ngrep | grep for the network layer. It uses pcap and allows matching packets by specifying extended regular expressions or hexadecimal expressions. | ngrep |
| nmap | Can scan your server's open ports and detect which operating system is being used | nmap |
| Spend | Check the size of a directory in Linux system | du -sh directory name |
| fdisk | View hard drive and partition information | fdisk -l |
1. Memory monitoring
1.1 free command
free can be used to quickly check the memory usage of the VPS host, including physical memory and virtual memory. You can add parameters later: -h and -m, otherwise it will be displayed in kb by default. The results of running the command are as follows:
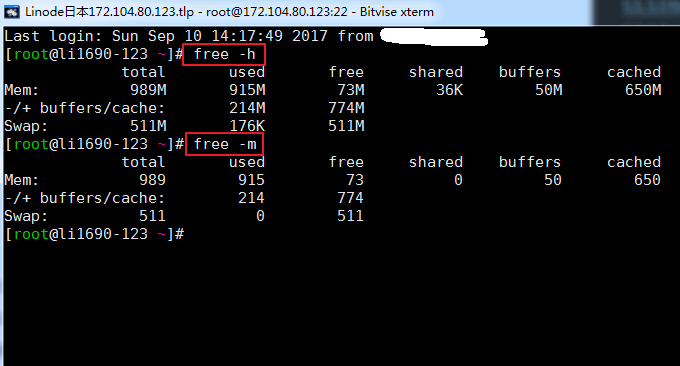
Relevant parameter description:
total: physical memory size, which is the actual memory of the machine
used: The memory size used by . This value includes cached and memory actually used by the application.
free: unused memory size
shared: shared memory size, which is a way of inter-process communication
buffers: memory size occupied by buffers
cached: memory size occupied by cache
1.2 vmstat command
vmstat (Virtual Meomory Statistics, virtual memory statistics) is a statistics of the overall situation of the system, including statistics of kernel processes, virtual memory, disks, traps and CPU activities. Command format: vmstat 2 100, where 2 represents the refresh interval and 100 represents the number of outputs. The results of running the command are as follows:

Relevant parameter description:
1 procs
- r column represents the number of processes running and waiting for CPU time slices. If this value is greater than the number of system CPUs for a long time, it means that the CPU resources are insufficient. You can consider increasing CPU ;
- Column b indicates the number of processes waiting for resources, such as waiting for I/O or memory swapping.
2 memories
- swpd column represents the amount of memory switched to the memory swap area (in KB). If the value of swpd is not 0 or is relatively large, and the values of si and so are 0 for a long time, then there is generally no need to worry about this situation, and it will not affect system performance;
- free column represents the current amount of free physical memory (in KB);
- buff column indicates the amount of memory in the buffers cache. Generally, buffering is required for reading and writing block devices;
- cache column indicates the amount of page cached memory. It is generally cached for the file system. Frequently accessed files will be cached. If the cache value is larger, it means there are more cached files. If the bi in IO is relatively small at this time, it means that the file system efficiency is better.
3 swap
- si column indicates the amount of memory transferred from the disk to the memory swap area;
- so column represents the amount transferred from memory to disk, that is, the amount of memory swap area entered into memory.
- Under normal circumstances, the values of si and so are both 0. If the values of si and so are not 0 for a long time, it means that the system memory is insufficient, and you need to consider whether to increase the system memory.
4IO
- bi column represents the total amount of data read from the block device (i.e. read disk, unit KB/second)
- bo column represents the total amount of data written to the block device (that is, writing to disk, in KB/second)
The bi+bo reference value set here is 1000, If it exceeds 1000, and A relatively large wa value indicates the system disk IO performance bottleneck .5 systems
- in column represents the number of device interrupts per second observed in a certain time interval;
- cs column represents the number of context switches generated per second.
The larger the above two values, the more CPU time you will see consumed by the kernel.6 CPU
- us column shows the percentage of time the user process consumed the CPU. When the value of us is relatively high, it means that the user process consumes a lot of CPU time. If it is greater than 50% for a long time, you need to consider optimizing the program or something.
- sy column shows the percentage of time the kernel process consumed the CPU. When the value of sy is relatively high, it means that the kernel consumes a lot of CPU time; If us+sy exceeds 80%, it means that the CPU resources are insufficient.
- id column shows the percentage of time the CPU is idle;
- wa column represents the percentage of CPU time occupied by IO waiting. The higher the wa value is, the more serious the IO wait is. If the wa value exceeds 20%, it means that the IO wait is serious .
- st column is generally not of concern, the percentage of time occupied by the virtual machine.
2. CPU monitoring
2.1 TOP command
The top command is a commonly used performance analysis tool under Linux, which can display the resource usage and overall status of each process in the system in real time. The running results are as follows:
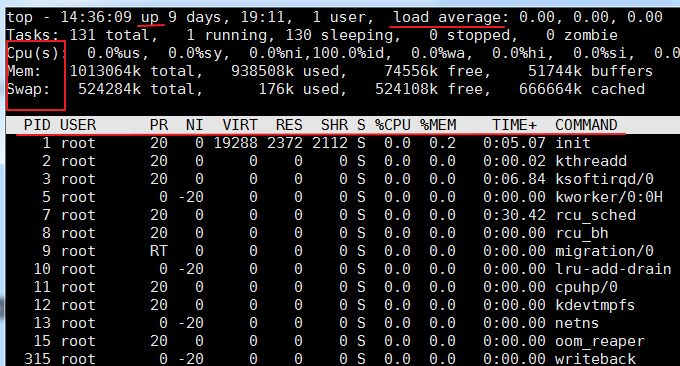
Related parameter description:
first row:
- 14:36:09: This is the system time during wzfou.com test
- up xxx days, 11:13: System running time, the system has been running for xx days, 11 hours and 13 minutes.
- 2 users: Number of currently logged in users
- load average: System load, that is, the average length of the task queue. The three values are the average load in the last 1 minute, the last 5 minutes, and the last 15 minutes respectively - exceeds N (number of CPU cores), indicating that the system is running at full load . You can also view the load average through the
$wor$uptimecommand.second line:
- Displays the total number of processes, the number of running processes, the number of dormant processes, the number of stopped processes, and the number of zombie processes
The third row:
- %us: Percentage of CPU consumed by user processes
- %sy: Percentage of CPU consumed by the kernel process
- %ni: The percentage of CPU occupied by processes that have changed their priority
- %id: Percentage of idle CPU
- %wa: CPU percentage consumed by IO waiting
2.2 mpstat command
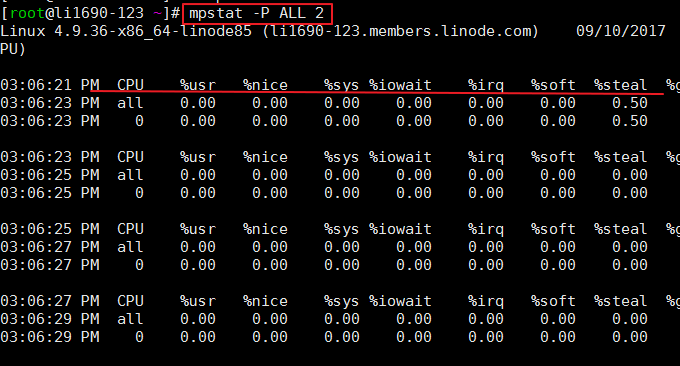
mpstat (Multiprocessor Statistics, multiprocessor statistics) is a real-time system monitoring tool that reports CPU-related statistical information, which is stored in the /proc/stat file. Format: mpstat -P ALL 2 # ALL means displaying all CPUs, or you can specify a certain CPU; 2 means refresh interval.
The effect of the command is as follows:
3. Network monitoring
3.1 sar command
SAR is a command used in Unix and Linux operating systems to collect, report and save the usage of CPU, memory, and input and output port. The SAR command can generate reports dynamically or save reports in log files. Command format: sar -n DEV 3 100. The effect is as follows:
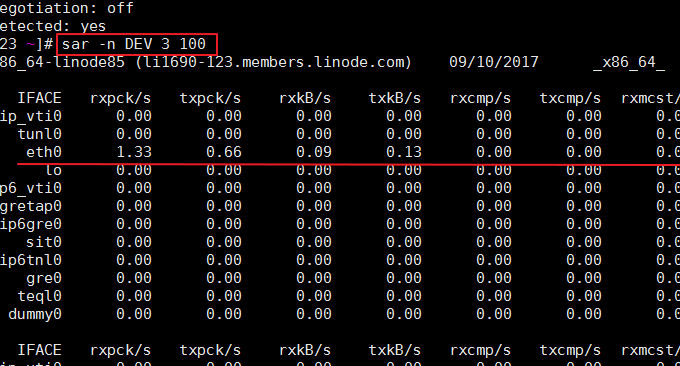
The relevant parameters are explained as follows:
IFACE: the name of the network device
rxpck/s: Number of packets received per second
txpck/s: Number of packets sent per second
rxkB/s: Number of bytes received per second
txkB/s: Number of bytes sent per second
3.2 netstat
The netstat command is generally used to check the network connection of each port of the machine and to display statistics related to IP, TCP, UDP and ICMP protocols.
Select some options as follows:
-a, --all, --listening     显示所有连接中的Socket。
-n, --numeric              以数字形式显示地址和端口号。
-t, -–tcp                  显示TCP传输协议的连线状况。
-u, -–udp                  显示UDP传输协议的连线状况。
-p, --programs             显示正在使用socket的程序名/进程ID
-l, --listening            显示监控中的服务器的Socket。
-o, --timers               显示计时器。
-s, --statistics           显示每个网络协议的统计信息(比如SNMP)
-i, --interfaces           显示网络界面信息表单(网卡列表)
-r, --route                显示路由表
Commonly used ones:
$ netstat -aup        # 输出所有UDP连接状况
$ netstat -atp        # 输出所有TCP连接状况
$ netstat -s          # 显示各个协议的网络统计信息
$ netstat -i          # 显示网卡列表
$ netstat -r          # 显示路由表信息
netstat is very useful in defending against attacks. An example commonly used by wzfou.com is as follows:
netstat -n -p|grep SYN_REC | wc -l
The above command can find out how many active SYNC_REC connections the current server has. Normally, this value is very small, preferably less than 5. When there are DoS attacks or mail bombs, this value is quite high. In addition, this value has a lot to do with the system. Some servers have very high values, which is normal.
netstat -n -p | grep SYN_REC | sort -u
The above command can list all connected IP addresses.
netstat -n -p | grep SYN_REC | awk '{print $5}' | awk -F: '{print $1}'The above command can list the IP addresses of all nodes sending SYN_REC connections.
netstat -ntu | awk '{print $5}' | cut -d: -f1 | sort | uniq -c | sort -nThe above command can use the netstat command to calculate the number of connections from each host to the local machine.
netstat -anp |grep 'tcp|udp' | awk '{print $5}' | cut -d: -f1 | sort | uniq -c | sort -nThe above command can list the IP numbers of all UDP or TCP connections connected to this machine.
netstat -ntu | grep ESTAB | awk '{print $5}' | cut -d: -f1 | sort | uniq -c | sort -nrThe above command checks for ESTABLISHED connections and lists the number of connections per IP address.
netstat -plan|grep :80|awk {'print $5'}|cut -d: -f 1|sort|uniq -c|sort -nk 1The above command can list all IP addresses connected to port 80 of this machine and their number of connections. Port 80 is generally used to handle HTTP web page requests.
To defend against CC attacks, you can also use the following methods to detect:
View the number of connections on all ports 80
- netstat -nat|grep -i "80"|wc -l
Sort connected IPs by number of connections
- netstat -anp | grep ‘tcp|udp’ | awk ‘{print $5}’ | cut -d: -f1 | sort | uniq -c | sort -n
- netstat -ntu | awk ‘{print $5}’ | cut -d: -f1 | sort | uniq -c | sort -n
- netstat -ntu | awk '{print $5}' | egrep -o "[0-9]{1,3}.[0-9]{1,3}.[0-9]{1,3}.[ 0-9]{1,3}" | sort | uniq -c | sort -nr
View TCP connection status
- netstat -nat |awk ‘{print $6}’|sort|uniq -c|sort -rn
- netstat -n | awk ‘/^tcp/ {print $NF}’|sort|uniq -c|sort -rn
- netstat -n | awk ‘/^tcp/ {++S[$NF]};END {for(a in S) print a, S[a]}’
- netstat -n | awk ‘/^tcp/ {++state[$NF]}; END {for(key in state) print key,”t”,state[key]}’
- netstat -n | awk ‘/^tcp/ {++arr[$NF]};END {for(k in arr) print k,”t”,arr[k]}’
- netstat -ant | awk ‘{print $NF}’ | grep -v ‘[a-z]’ | sort | uniq -c
View the 20 IPs with the most connections on port 80
- cat /www/web_logs/wzfou.com_access.log|awk ‘{print $1}’|sort|uniq -c|sort -nr|head -100
- tail -n 10000 /www/web_logs/wzfou.com_access.log|awk ‘{print $1}’|sort|uniq -c|sort -nr|head -100
- cat /www/web_logs/wzfou.com_access.log|awk ‘{print $1}’|sort|uniq -c|sort -nr|head -100
- netstat -anlp|grep 80|grep tcp|awk ‘{print $5}’|awk -F: ‘{print $1}’|sort|uniq -c|sort -nr|head -n20
- netstat -ant |awk '/:80/{split($5,ip,":");++A[ip[1]]}END{for(i in A) print A,i}' |sort -rn |head -n20
Use tcpdump to sniff port 80 access to see who is the highest
- tcpdump -i eth0 -tnn dst port 80 -c 1000 | awk -F”.” '{print $1″.”$2″.”$3″.”$4}' | sort | uniq -c | sort -nr |head - 20
Find more time_wait connections
- netstat -n|grep TIME_WAIT|awk ‘{print $5}’|sort|uniq -c|sort -rn|head -n20
Find more SYN connections
- netstat -an | grep SYN | awk ‘{print $5}’ | awk -F: ‘{print $1}’ | sort | uniq -c | sort -nr | more
Some common commands to use iptables to block IP segments under Linux:
The command to block a single IP is:
- iptables -I INPUT -s 211.1.0.0 -j DROP
The command to block an IP segment is:
- iptables -I INPUT -s 211.1.0.0/16 -j DROP
- iptables -I INPUT -s 211.2.0.0/16 -j DROP
- iptables -I INPUT -s 211.3.0.0/16 -j DROP
The command to seal the entire section is:
- iptables -I INPUT -s 211.0.0.0/8 -j DROP
The command to seal several paragraphs is:
- iptables -I INPUT -s 61.37.80.0/24 -j DROP
- iptables -I INPUT -s 61.37.81.0/24 -j DROP
3.3 tcpdump command
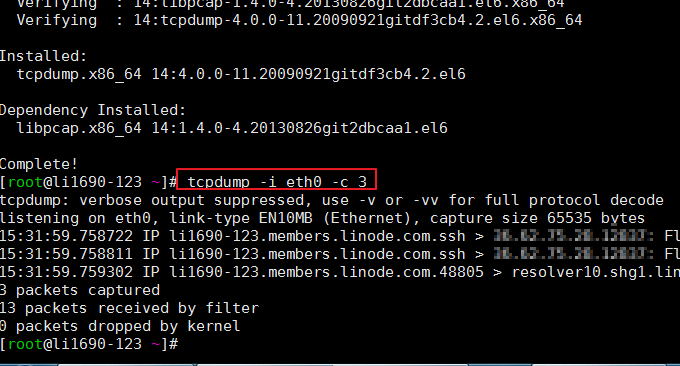
Tcpdump is one of the most widely used network packet analyzers or packet monitoring programs. It is used to capture or filter TCP/IP packets received or transmitted on specified interfaces on the network. Format: tcpdump -i eth0 -c 3
This command does not come with the system and you may need to install it yourself. The command execution effect is as follows:
3.4 IPTraf
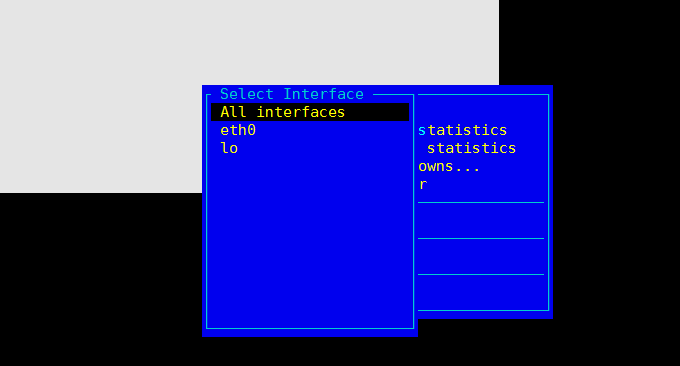
iptraf is an IP LAN monitor based on ncurses, used to generate statistical data including TCP information, UDP counts, ICMP and OSPF information, Ethernet load information, node status information, IP checksum errors, etc. Simple and detailed interface statistics, including IP, TCP, UDP, ICMP, non-IP and other IP packet counts, IP checksum errors, interface activity, and packet size counts.
Command format: iptraf. Several monitoring menus will then be displayed, with the following effects:
4. Disk monitoring
4.1 df command
The function of the df command is to check the disk space usage of the Linux file system. If no file name is specified, all currently mounted file systems are displayed, in KB by default. Commonly used format: $ df -h. The effect is as follows:
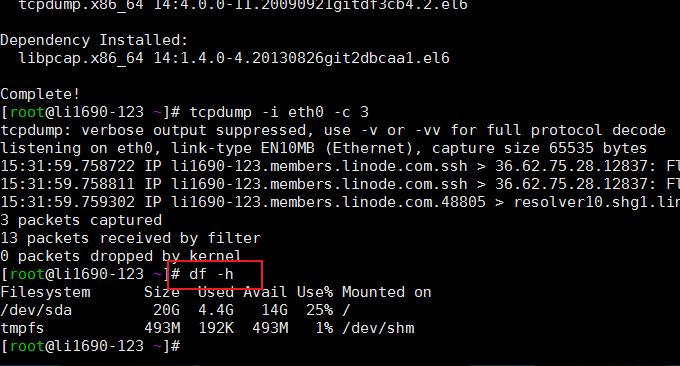
The relevant parameters are explained as follows:
-a List of all file systems
-h display in human-readable form
-i Display inode information
-T displays file system type
-l Show only local file systems
-k in KB
-m in MB
4.2 iostat command
iostat is a simple tool for collecting and displaying statistics on the input and output status of system storage devices. This tool is often used to track performance issues with storage devices, including devices, local disks, and remote disks such as using NFS. Commonly used formats:
$ iostat -x -k 2 100 # 2表示刷新间隔,100表示刷新次数
The effect is as follows:
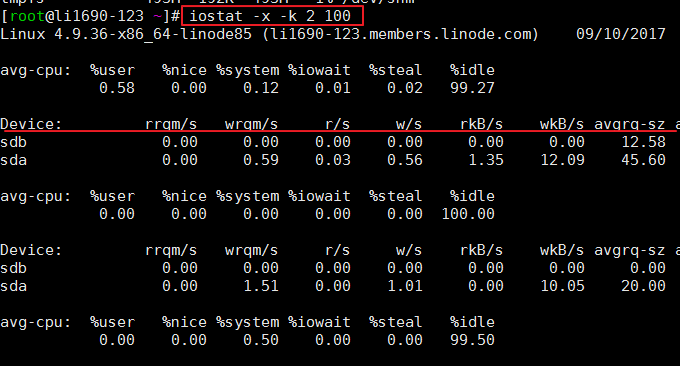
iostat is mainly used to monitor disk I/O. First, it outputs the average data of CPUs (avg-cpu). We can see the item %iowait. In addition, iostat Some more detailed I/O status data are also provided, such as:
r/s: The number of reads from the I/O device completed per second.
w/s: The number of writes to the I/O device completed per second.
rkB/s: The number of K bytes read per second. It is half of rsect/s because the size of each sector is 512 bytes.
wkB/s: The number of K bytes written per second. It is half of wsect/s.
avgrq-sz: Average data size (sectors) per device I/O operation.
avgqu-sz: Average I/O queue length.
await: average waiting time (milliseconds) for each device I/O operation.
svctm: Average service time (milliseconds) per device I/O operation.
%util: What percentage of a second is used for I/O operations, or how much of a second the I/O queue is non-empty.
4.3 iotop command
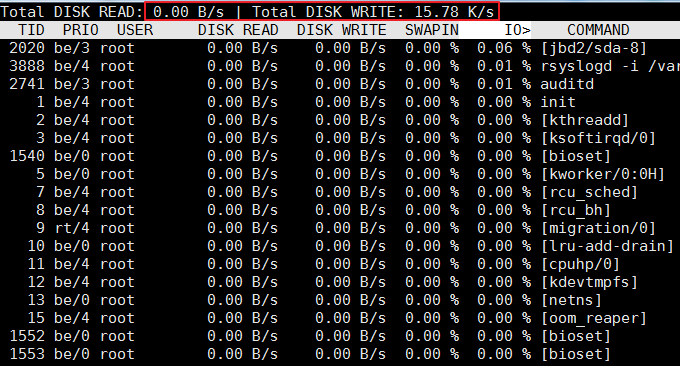
The iotop command is a top-like tool used to monitor disk I/O usage. iotop has a UI similar to top, including PID, user, I/O, process and other related information. Most of the IO statistics tools under Linux, such as iostat and nmon, can only count the reading and writing of the per device. If you want to know how each process uses IO, it will be troublesome. You can use the iotop command to check it easily.
Commonly used parameters of iotop are as follows:
–version View program version number
-h, –help View help information
-o, –only View only processes with IO operations
-b, –batch non-interactive mode
-n, – iter= Set the number of iterations
-d, –delay refresh frequency, the default is 1 second
-p, –pid view the IO of the specified process number, the default is all processes
-u, –user view the specified IO of user processes, the default is all users
-P, –processes only looks at processes, not threads
-a, –accumulated looks at accumulated IO, not real-time IO
-k, –kilobytes in KB View IO in units instead of displaying it in the most friendly unit
-t, –time Add a timestamp to each line, and enable –batch
-q by default, –quit does not display header information
The execution effect is as follows:
4.4 lsof command
List open files: lsof. It is commonly used to display all open files and processes in a list. Open files include disk files, network sockets, pipes, devices, and processes. One of the main situations to use this command is when cannot mount the disk and displays an error message that a file is being used or opened. Using this command you can easily see which file is being used.
5. Process monitoring
5.1 aTOP command
The atop command is a terminal environment monitoring command. It shows a combination of various system resources (CPU, memory, network, I/O, kernel) and is color-coded under high load conditions. atop can be regarded as an enhanced version of top. If the atop command shows that it does not exist, you need yum or apt-get to install it. The effect is as follows:
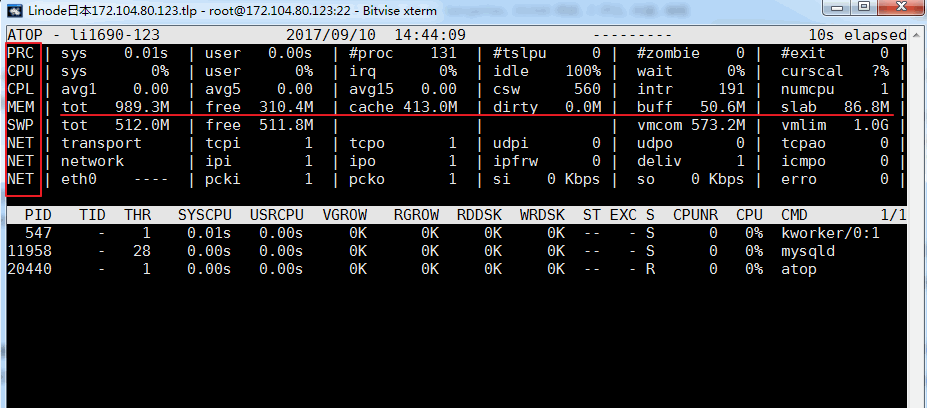
Related parameter description:
ATOP column : This column displays the host name, information sampling date and time point
PRC column: This column displays the overall running status of the process
- The sys and usr fields indicate the running time of the process in kernel mode and user mode respectively.
- The #proc field indicates the total number of processes
- The #zombie field indicates the number of zombie processes
- The #exit field indicates the number of processes that exited during the atop sampling period
CPU column : This column displays the usage of the entire CPU (i.e., multi-core CPU as a whole CPU resource). We know that the CPU can be used to execute processes, handle interrupts, or be in an idle state (idle state is divided into Two types, one is the active process waiting for disk IO causing the CPU to be idle, the other is completely idle)
- The sys and usr fields indicate the proportion of CPU time occupied by the process in kernel mode and user mode when the CPU is used to process the process.
- The irq field indicates the proportion of time the CPU was spent processing interrupts
- The idle field indicates the proportion of time the CPU was completely idle.
- The wait field indicates the proportion of time the CPU is in the state of "the process is waiting for disk IO causing the CPU to be idle"
The sum of the indicated values in each field of the CPU column results in N00%, where N is the number of CPU cores.
cpu column: This column displays the usage of a certain core CPU. The meaning of each field can be referred to the CPU column. The sum of each field value is 100%.
CPL column: This column displays the CPU load
- avg1, avg5, and avg15 fields: average number of processes in the run queue over the past 1, 5, and 15 minutes
- The csw field indicates the number of context swaps
- The intr field indicates the number of interrupt occurrences
MEM column: This column indicates memory usage
- The tot field indicates the total amount of physical memory
- The free field indicates the size of free memory
- The cache field indicates the memory size used for page caching
- The buff field indicates the memory size used for file caching
- The slab field indicates the memory size occupied by the system kernel.
SWP column: This column indicates swap space usage
- The tot field indicates the total amount of swap area
- The free field indicates the size of free swap space
PAG column: This column indicates virtual memory paging status
swin, swout fields: number of memory pages swapped in and out
DSK column : This column indicates disk usage. Each disk device corresponds to one column. If there is an sdb device, then an additional column of DSK information is added.
- sda field: disk device identification
- busy field: disk busy ratio
- read, write fields: number of read and write requests
NET column : Multiple columns of NET show the network status, including the transport layer (TCP and UDP), IP layer and each active network port information
- The XXXi field indicates the number of packets received by each layer or active network port.
- The XXXo field indicates the number of packets sent by each layer or active network port
5.2 htop command
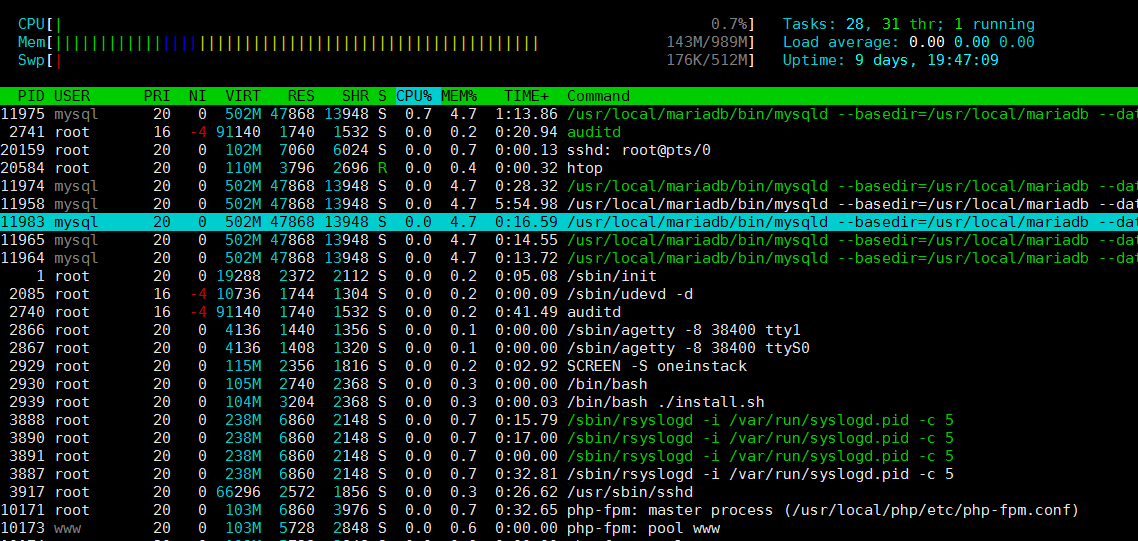
htop is a very advanced interactive real-time Linux process monitoring tool. It is very similar to the top command, but it has richer features, such as user-friendly process management, shortcut keys, vertical and horizontal display of processes, etc.
The effect of the command is as follows:
5.3 ps command
ps (Process Status, process status) command is the most basic and very powerful process viewing command. The most commonly used command is ps aux - displays all current processes
$ ps aux | grep root       # 输出root用户的所有进程
$ ps -p <pid> -L            # 显示进程<pid>的所有线程
$ ps -e -o pid,uname,pcpu,pmem,comm  # 定制显示的列
$ ps -o lstart <pid>        # 显示进程的启动时间
The output of the ps command can be sorted by any column by using the internal sort key (alias of the column), for example:
$ ps aux --sort=+rss         # 按内存升序排列
$ ps aux --sort=-rss        # 按内存降序排列
$ ps aux --sort=+%cpu        # 按cpu升序排列
$ ps aux --sort=-%cpu       # 按cpu降序排列
6. All-in-one system monitoring tool
The tools shared above are all single tools for viewing Linux system disk, CPU, memory and other indicators. If we want to quickly find out the performance bottleneck of the VPS host, we can use the following "all-in-one" tools:
6.1 glances tool
Glances is a GPL-licensed free software used to monitor GNU/Linux and FreeBSD operating systems. Through Glances, we can monitor CPU, load average, memory, network traffic, disk I/O, other processors and file system space utilization. Condition. This is what wzfou.com uses for monitoring. Syntax: glances
Glances will use the following colors to represent the status: Green: OK (everything is normal) Blue: CAREFUL (needs attention) Purple: WARNING (warning) Red: CRITICAL (serious). The threshold can be set in the configuration file. Generally, the threshold is set to (careful=50, warning=70, critical=90) by default. The effect is as follows: (click to enlarge)

Glances also provides more shortcut keys that can turn on and off output information options when it is running, for example:
a – Automatically sort processes
c – Sort processes by CPU percentage
m – Sort processes by memory percentage
p – Sort processes alphabetically by process name
i – Sort processes by read and write frequency (I/O)
d – Show/hide disk I/O statistics
f – Show/hide file system statistics
n – Show/hide network interface statistics
s – Show/hide sensor statistics
y – Show/hide hard drive temperature statistics
l - show/hide log (log)
b – Switch network I/O units (Bytes/bits)
w – delete warning log
x – Remove warning and critical logs
1 – Toggle between global CPU usage and per-CPU usage
h – Show/hide this help screen
t – Browse network I/O in groups
u – Browse network I/O in cumulative form
q – exit (‘ESC‘ and ‘Ctrl&C‘ also work)
6.2 dstat tool
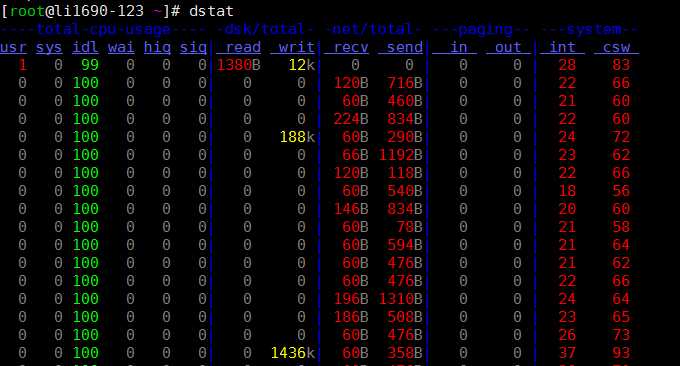
The dstat command is a tool used to replace vmstat, iostat, netstat, nfsstat and ifstat commands. It is an all-round system information statistics tool. Compared with sysstat, dstat has a colorful interface. When manually observing performance conditions, the data is more conspicuous and easy to observe; and dstat supports instant refresh. For example, entering dstat 3 will collect it every three seconds, but the latest data will be refreshed every second. show.
Use dstat directly. The -cdngy parameter is used by default to display cpu, disk, net, page, and system information respectively. The default is to display one message every 1 second. You can specify the time interval for displaying a piece of information at the end. For example, dstat 5 means that one piece of information will be displayed every 5 seconds, and dstat 5 10 means that one piece of information will be displayed every 5 seconds. A total of 10 pieces of information will be displayed. as follows:

Description of the information displayed by the default output:
Procs
- r: The number of running and waiting (CPU time slice) running processes. This value can also be used to determine whether the CPU needs to be increased (long-term greater than 1)
- b: The number of processes in an uninterruptible state. Common situations are caused by IO.
Memory
- swpd: Switch to memory on swap memory (default in KB). If the value of swpd is not 0, or is relatively large, such as more than 100M, but the values of si and so have been 0 for a long time, we don't need to worry about this situation, and it will not affect system performance.
- free: free physical memory
- buff: used as buffer cache memory, buffering the reading and writing of block devices
- cache: memory as page cache, file system cache. If the cache value is large, it means that there are many files in the cache. If frequently accessed files can be cached, the read IO bi of the disk will be very small.
Swap
- si: Swap memory usage, transferred into memory from disk
- so: Swap memory usage, transfer from memory to disk
When there is enough memory, these two values are both 0. If these two values are greater than 0 for a long time, system performance will be affected. Disk IO and CPU resources will be consumed.
I found that some friends think that the memory is not enough when they see that the free memory (free) is very small or close to 0. In fact, you cannot just look at this, but also combine si and so. If there is very little free, but si, There are also very few so (mostly 0), so don't worry, the system performance will not be affected at this time.
Disk IO
- bi: The total amount of data read from the block device (read disk) (KB/s)
- bo: The total amount of data written to the block device (write to disk) (KB/s)
Note: When reading and writing random disks, the larger the two values are (such as exceeding 1M), the larger the value that the CPU is waiting for in IO will be seen.
System
- in: Number of interrupts generated per second
- cs: number of context switches per second
The larger the above two values are, the more CPU time you will see consumed by the kernel.
CPU
- usr: The percentage of CPU time consumed by the user process
When the value of us is relatively high, it means that the user process consumes a lot of CPU time, but if it exceeds 50% usage for a long time, then we should consider optimizing the program algorithm or speeding up (such as PHP/Perl)
- sys: Percentage of CPU time consumed by the kernel process
When the value of sys is high, it means that the system kernel consumes a lot of CPU resources. This is not a benign performance and we should check the reason.
- wai: Percentage of CPU time consumed by IO waiting
When the value of wa is high, it means that the IO waiting is serious. This may be caused by a large number of random accesses on the disk, or it may be a bottleneck (block operation) in the bandwidth of the disk.
- idl: Percentage of time the CPU is in idle state
7. Summary
For the above commands, some of them come with the Linux system and you can execute them directly. Some are third-party commands, but most of them can be installed directly through Yum install xxx or apt-get intall xxx to install . Although these commands are small, they will be particularly useful when problems arise on our servers.
To troubleshoot server problems, we generally need to combine multiple indicators for comprehensive analysis and judgment. For example, if you suspect that there is a problem with the IO reading and writing of the VPS host, you can use iotop to check the real-time speed of reading and writing, and use the top command to check which processes occupy the CPU and memory. In this way, you can get the correct result by combining multiple data.
