Recently I found that the memory of the blog was always being "eaten" every now and then. After logging in to the backend, there would occasionally be lags. At first, I suspected that it was caused by insufficient Swap, so I added a few G of Swap to the VPS host and observed. After a while, I found that no matter how big the Swap was, it was slowly "eaten"!
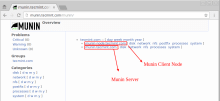
Two excellent server network traffic monitoring tools: Ntopng and Munin - powerful and intuitive
If we find that our VPS server is abnormal, generally we can analyze it from the server logs to see if there is an IP source that does not follow the "rules". For example, we can use server log analysis tools: ngxtop and GoAccess to analyze the IP source, number of connections, error requests, browsers, traffic bandwidth, etc. in the statistical logs.
Installation and use of Zabbix - a powerful server performance monitoring tool to control server software and hardware resources
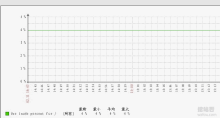
In order to monitor the network line conditions of different local computer rooms of major VPS hosting providers, we can use the free open source network performance monitoring tool to visualize the master/slave deployment of Smokeping. Smokeping's powerful and intuitive drawing can help us understand the network conditions of the IDC computer room within a certain period of time.
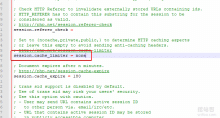
How to enable Nginx fastcgi_cache cache acceleration in WordPress - Nginx configuration example
In the process of using WordPress to build a website, many "detours" have been taken in optimizing WordPress performance and speeding up website access. When the website access is slow and the CPU memory is exhausted, the first thing I think of is upgrading the server configuration. Later, I find that some unscrupulous VPS merchants severely restrict resources behind the scenes, and it is really hurtful to pay more to upgrade.
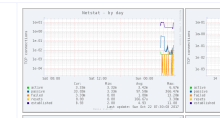
Free open source PHP probe x-prober and cool Linux server performance real-time monitoring tool Netdata
Many times, friends who engage in server maintenance hope to have a server performance monitoring platform that can provide an overall overview, so that they can grasp the running dynamics of the company's servers in real time. There are currently many third-party network performance monitoring platforms on the market, such as Alibaba Cloud, Tencent Cloud, Linode, Vultr and other VPS hosting providers with their own server performance monitoring services.
Network monitoring tools: SmokePing Nginx one-click installation/management script and Looking Glass Chinese translation
Smokeping is an open source and free network performance monitoring tool. It is mainly used to monitor network performance, including conventional ping, dig, echoing, curl, etc. The advantage of Smokeping is that it uses rrdtool to draw pictures, and the monitoring images are updated in real time and are beautiful.
Solution to Linux system disk space full-No Space Left on Device error
Regarding the problem of the Linux disk being full, I have encountered it before when using the WDCP panel because the website log was enabled in the background of the panel, but the log was not deleted regularly. In the long run, the disk space of the VPS host was filled up with logs. When the disk space reaches 100%, some inexplicable errors will occur on the website, such as being unable to log in to the background, unable to comment, and the page is blank, etc.
Three Steps to Uncover Abnormal Server Traffic - Linux Server Traffic Bandwidth Monitoring and Statistical Commands
Last time, a friend raised a question about the storage of English picture sites in the website digging forum. There was a sentence in the description of the problem that particularly impressed me - " I do not recommend VPS bare metal to novices, even if you are proficient. If you use WP to build a website, you may not be able to handle server management. " I actually heard this sentence when I first started building a website, so I took a lot of detours and suffered a lot of "dumb losses." .


