
If we find that our VPS server is abnormal, generally we can analyze it from the server logs to see if there is an IP source that does not follow the "rules". For example, we can use server log analysis tools: ngxtop and GoAccess to analyze the IP source, number of connections, error requests, browsers, traffic bandwidth, etc. in the statistical logs.
At the same time, for some complex website applications, the causes of abnormalities can also be analyzed from the server's network traffic. This article will share two very practical server network traffic monitoring tools: ntopng and Munin. ntopng is a new generation version of NTOP. The original official version of NTOP is no longer updated. The new ntopng is very powerful in monitoring network data transmission and troubleshooting network faults.
ntopng analyzes network traffic to determine various problems on the network. It can also monitor whether hackers are attacking the network. If the network suddenly slows down, through the data packets intercepted by Ntop, it can be determined what type of data packets occupy a large amount of bandwidth. , as well as the sending time of the data packet, the delay of data packet transmission, the source address of the data packet, etc.
Another excellent server monitoring tool, Munin, is a great system monitoring tool similar to the RRD tool. It can provide you with various system performance information, such as disk, network, process, system and users. Munin can This information generates Html web pages, so you can browse various monitoring data directly through the web pages. Munin also supports master-slave mode monitoring.

As a grassroots webmaster, it is very useful to master certain webmaster tools, especially when your server encounters an "attack", these "sharp tools" can exert its defensive capabilities.
- Server log analysis tools: ngxtop and GoAccess - real-time monitoring and visual management to quickly find the source of exceptions
- Smokeping installation and configuration - free open source network performance monitoring tool visual master/slave deployment
- Three command tools Rsync, SCP, and Tar-quick solution to VPS remote website relocation and data synchronization
1. Installation and use of ntopng
1.1 Preparation before installation
Official website:
- HTTP://wuwuwu.yeartop.org/
Taking Ubuntu 16.04 as a demonstration, upgrade before starting the installation:
sudo apt-get update -y
sudo apt-get upgrade -y
sudo shutdown -r now
1.2 Install Ntopng
Just use the command to install it directly:
sudo apt-get install ntopng
1.3 Configure Ntopng
The configuration file is located at: /etc/ntopng.conf.
sudo vim /etc/ntopng.conf
Modify the configuration according to your own needs:
# DO NOT REMOVE the following option, required for daemonization.
-e=

# * Interfaces to sniff on: one interface per line, prefix with -i=
# If none is specified, ntopng will try to auto-detect the best interface.

-i=eth0

# * Port on which ntopng will listen for the web-UI.
-w=3000
Save the configuration file and restart ntopng:
sudo systemctl restart ntopng
ntopng also provides a lot of options, you can use ntopng -h to view:
sudo ntopng -h
1.4 Open port
You need to open the corresponding port in the VPS firewall. For example, if 3000 is used above, then you need to add the following to the firewall rules:
sudo ufw allow 3000
1.5 Ntopng use
Open your browser, access the IP+port number, and you will see the Ntopng login interface. Use the default username admin and password admin to log in.
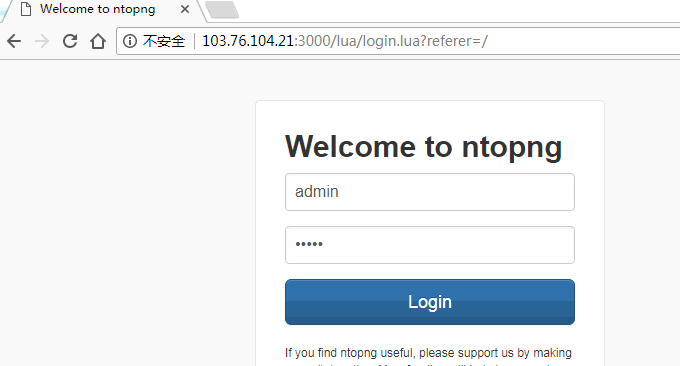
Ntopng provides very beautiful network traffic graphs.
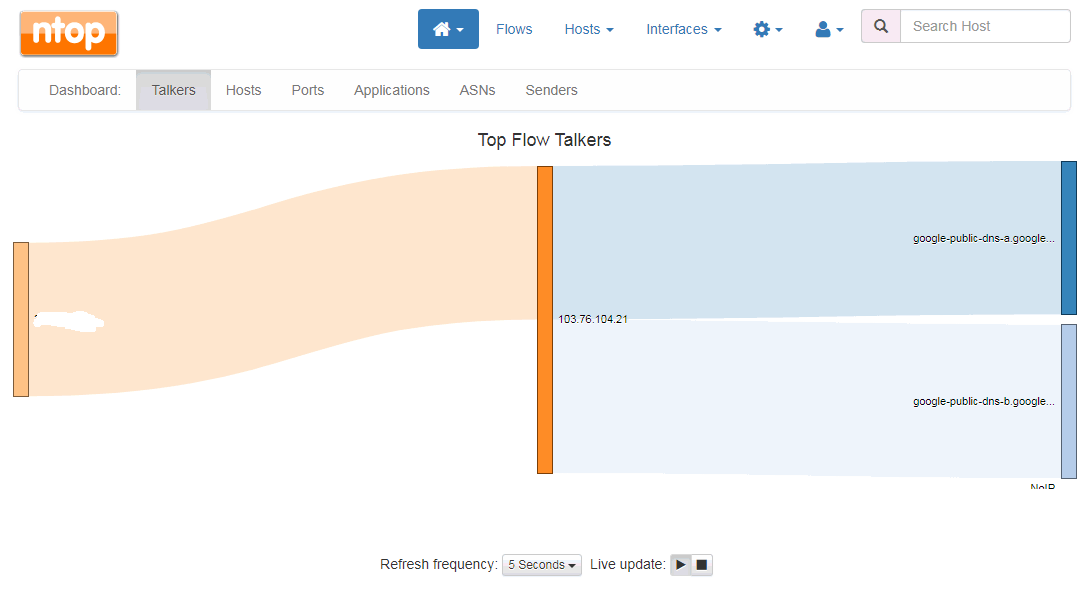
Click to view real-time connection data analysis, including IP address, upload and download speed, protocol, process, etc.

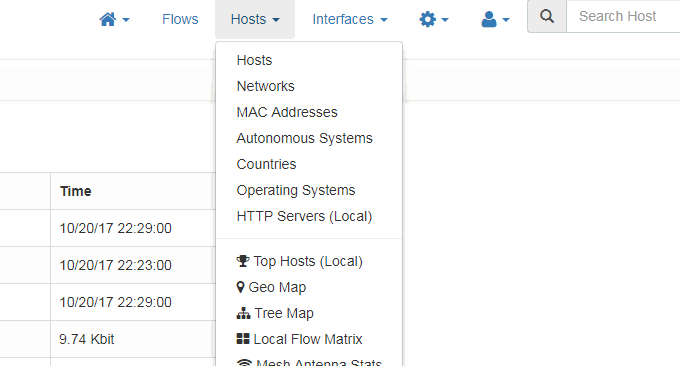
Ntopng also has a wealth of charts to choose from, such as traffic analysis charts listed according to IP address, network connection client, operating system, Mac address, etc.
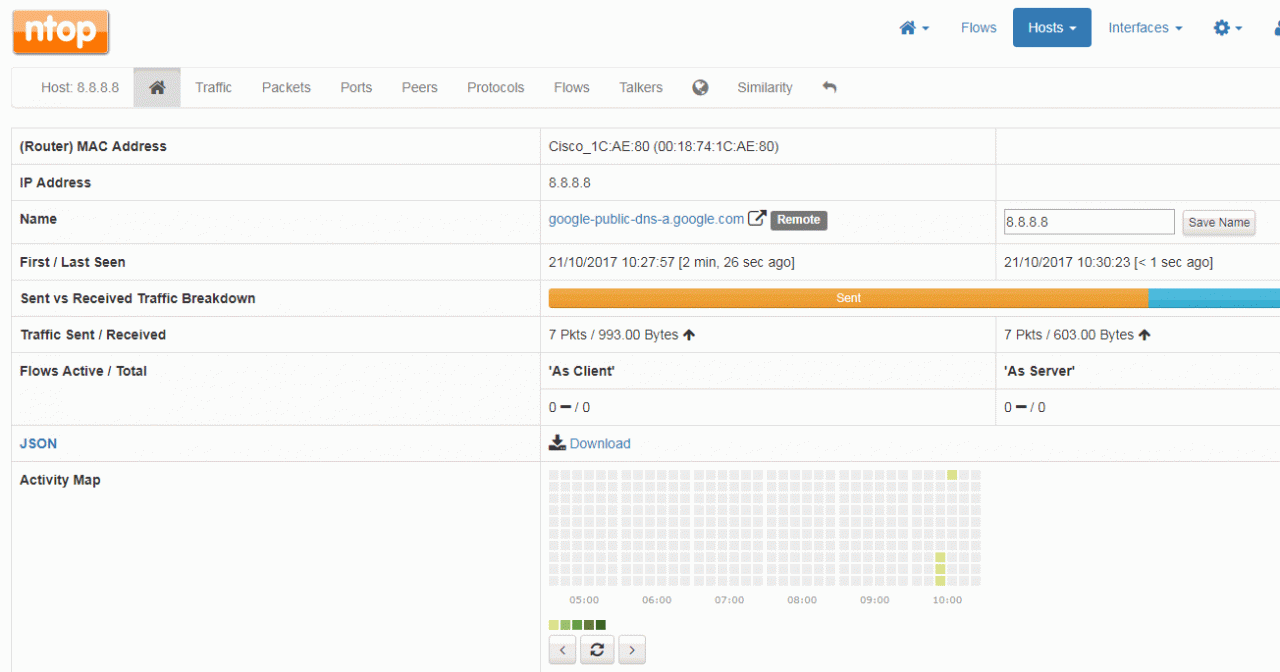
If you are interested in a certain connection, you can click to enter the view details page, where Ntopng will display detailed information about the current IP connection server, such as time, protocol, upload, download, Mac, etc. (Click to enlarge)
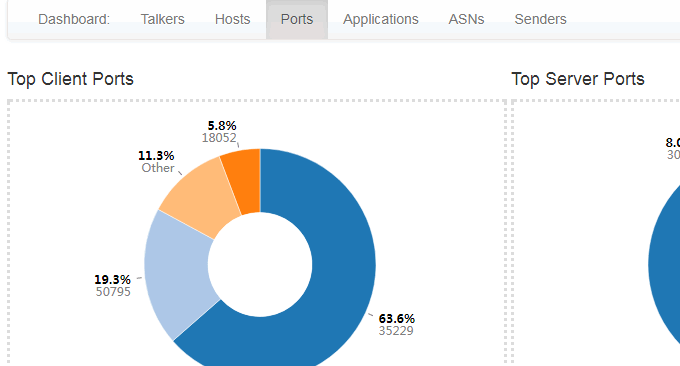
Ntopng also has some general statistical summaries, such as port occupancy statistics.
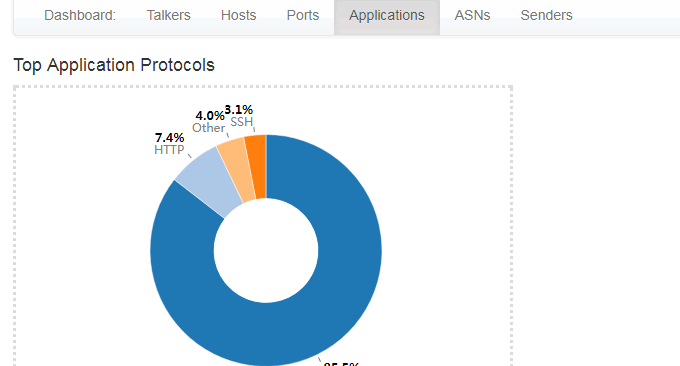
There is also application statistics summary.
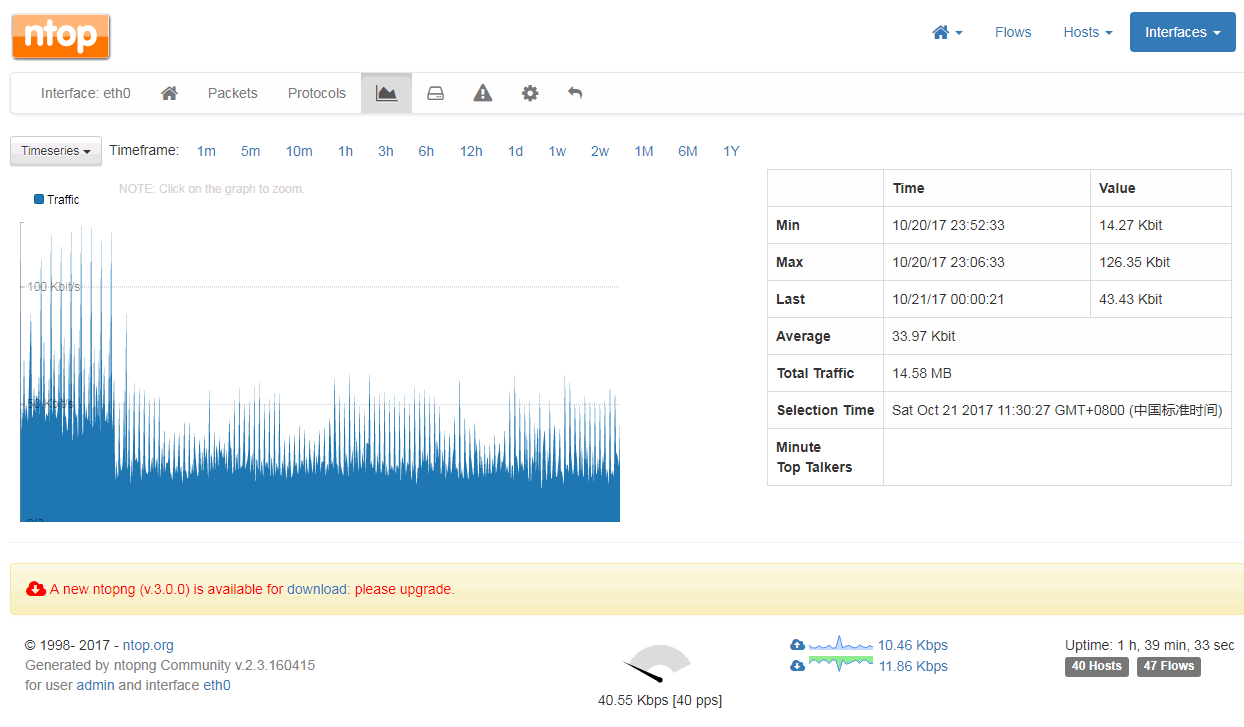
It also provides statistics and summary of network card traffic based on time, ranging from 5 minutes to 1 year, including real-time traffic statistics. You just need to click on the timeline you want to display. (Click to enlarge)
2. Installation and use of Munin
Official website:
- HTTP://木你-monitoring.org/
2.1 Quickly install Munin
If your server has been configured with a Web environment, you only need to install Munin. If it is a Debian or Ubuntu system: apt-get install munin munin-node, if it is a Redhat or CentOS system: yum install munin munin-node.
Then open munin's main configuration file: /etc/munin/munin.conf. htmldir /var/www/munin is the path for Web access. You can specify these paths to a place where Web access can be used directly.
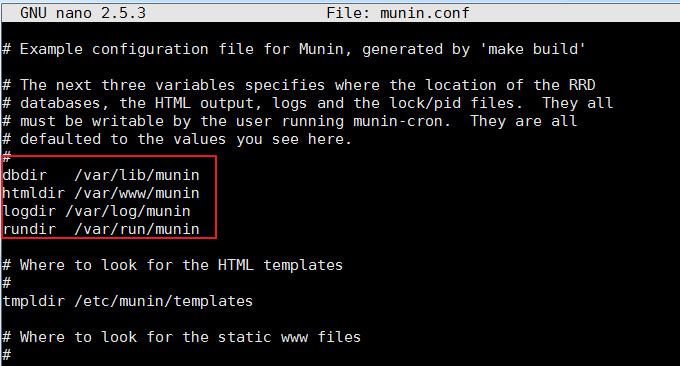
After specifying the Web access directory, you need to set the directory permissions to munin, otherwise munin cannot write data. Command: chown -R munin:munin /home/wwwroot/monin
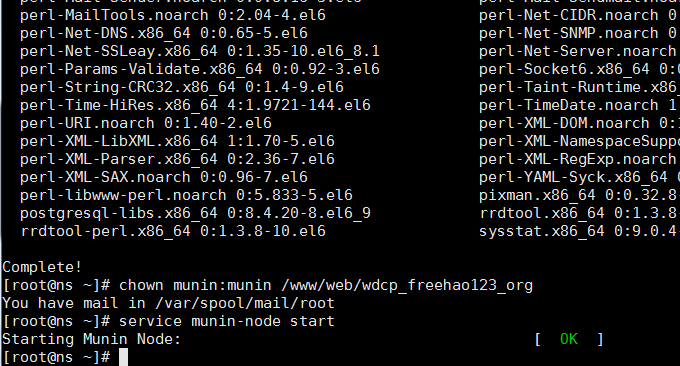
Finally, wait for half an hour, open your website and you can see munin’s monitoring chart data.
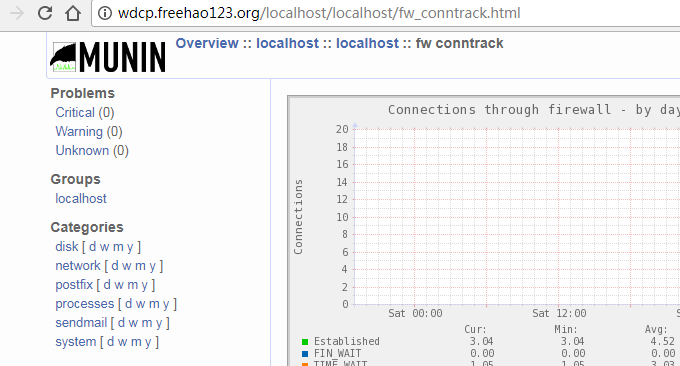
2.2 Manually install Munin
If you do not have a web environment installed, such as LNMP and Oneinstack, then you can manually install Apache and Munin. Here we use CentOS and Fedora as demonstrations:
2.3 Install EPEL Repository
Install using the following command:
RHEL/CentOS 7
------------------ RHEL/CentOS 7 - 64-Bit ------------------
# wget http://dl.fedoraproject.org/pub/epel/7/x86_64/e/epel-release-7-9.noarch.rpm
# rpm -ivh epel-release-7-9.noarch.rpm
RHEL/CentOS 6
------------------ RHEL/CentOS 6 - 32-Bit ------------------
# wget http://download.fedoraproject.org/pub/epel/6/i386/epel-release-6-8.noarch.rpm
# rpm -ivh epel-release-6-8.noarch.rpm
------------------ RHEL/CentOS 6 - 64-Bit ------------------
# wget http://dl.fedoraproject.org/pub/epel/6/x86_64/epel-release-6-8.noarch.rpm
# rpm -ivh epel-release-6-8.noarch.rpm
RHEL/CentOS 5
------------------ RHEL/CentOS 5 - 32-Bit ------------------
# wget http://download.fedoraproject.org/pub/epel/5/i386/epel-release-5-4.noarch.rpm
# rpm -ivh epel-release-5-4.noarch.rpm
------------------ RHEL/CentOS 5 - 64-Bit ------------------
# wget http://download.fedoraproject.org/pub/epel/5/x86_64/epel-release-5-4.noarch.rpm
# rpm -ivh epel-release-5-4.noarch.rpm
After installing it, upgrade it:
------------------ On RHEL and CentOS Only ------------------
# yum -y update
2.4 Install Apache
Munin requires Apache or Nginx to provide static Html access. Let’s install Apache as an example:
------------------ On RHEL, CentOS and Fedora ------------------
# yum install httpd
------------------ On Fedora 22+ Releases ------------------
# dnf install httpd
After Apache is installed, set it to start automatically at boot.
------------------ On RHEL, CentOS and Fedora ------------------
# service httpd start
# chkconfig --level 35 httpd on
------------------ On RHEL/CentOS 7 and Fedora 22+ ------------------
# systemctl enable httpd
# systemctl start httpd
2.5 Install Munin and Munin-Node
Install Munin and Munin-Node directly using the following commands:
------------------ On RHEL, CentOS and Fedora ------------------
# yum -y install munin munin-node
------------------ On Fedora 22+ Releases ------------------
# dnf -y install munin munin-node
After Munin is installed, you can start editing the Munin configuration file. The following is the directory of Munin-related functions:
/etc/munin/munin.conf : Munin configuration file.
/etc/cron.d/munin: Munin timing file.
/etc/httpd/conf.d/munin.conf : Munin Apache configuration file.
/var/log/munin : Munin log.
/var/www/html/munin : Munin web directory.
/etc/munin/munin-node.conf : Munin slave node configuration file.
/etc/munin/plugins.conf : Munin plugins configuration file.
Finally, restart Munin and set it to start automatically at boot:
------------------ On RHEL, CentOS and Fedora ------------------
# service munin-node start
# chkconfig --level 35 munin-node on
------------------ On RHEL/CentOS 7 and Fedora 22+ ------------------
# systemctl enable munin-node
# systemctl start munin-node
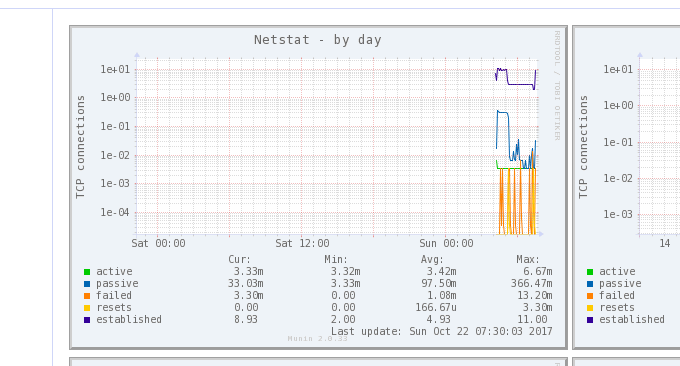
Open the browser and you can see the data chart monitored by Munin.
2.6 Munin monitors the status of multiple servers
Enter your other VPS host, you only need to install munin-node:
# yum install munin-node
# dnf install munin-node      [On Fedora 22+ versions]
# apt-get install munin-node  [On Debian based systems]
Then open /etc/munin/munin-node.conf and add your munin host server IP.
# vi /etc/munin/munin-node.conf
Assume that the IP of your Munin main server is 192.168.0.103, and the format is as follows:
# A list of addresses that are allowed to connect.
allow ^127.0.0.1$
allow ^::1$
allow ^192.168.0.103$
Restart munin client:
------------------ On RHEL, CentOS and Fedora ------------------
# service munin-node start
# chkconfig --level 35 munin-node on
------------------ On RHEL/CentOS 7 and Fedora 22+ ------------------
# systemctl enable munin-node
# systemctl start munin-node
Now open in your Munin main server: /etc/munin/munin.conf Add your client node, mainly the name and IP address:
# a simple host tree
[munin.wzfou.com]
address 127.0.0.1
use_node_name yes
[node.wzfou.com]
address 192.168.0.15
use_node_name yes
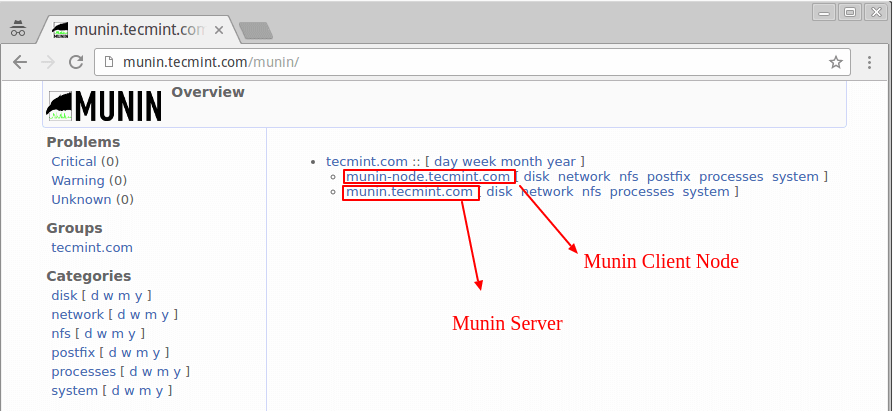
Finally, restart the munin server and open http://munin.wzfou.com/munin to see the monitoring data chart of the master and slave nodes.
3. Summary
Ntopng and Munin are both very good network monitoring tools. Both can generate charts for online browsing, but each tool has its own focus. Ntopng can be said to be a professional-level monitoring of network traffic. You can even see the network in Ntopng. Connect various information from the client, which is very useful for analyzing network attacks.
Munin can be said to be a comprehensive server performance monitoring platform. In addition to obtaining information such as network traffic, you can also see various information such as hard disk capacity, IO reading and writing, CPU usage, memory usage, etc. It is more suitable for all-round use of servers. monitor. If you do not want to make the data charts generated by Munin public, you can use Apache to set an access password.
