Many times, friends who engage in server maintenance hope to have a server performance monitoring platform that can provide an overall overview, so that they can grasp the running dynamics of the company's servers in real time. There are currently many third-party network performance monitoring platforms on the market, such as Alibaba Cloud, Tencent Cloud, Linode, Vultr and other VPS hosting providers with their own server performance monitoring services.
If you build your own server monitoring platform, you can try the server log analysis tools we shared before: ngxtop and GoAccess, which can help us view server abnormalities from the perspective of analyzing server logs. You can also use the Smokeping tool to monitor the status of the server's network line, such as regular ping, dig, echoing, curl, etc.
This article will share two excellent server monitoring tools: one is the free open source PHP probe-x-prober. There are many PHP probes on the Internet, but x-prober is suitable for "beauty lovers"; the other is Netdata, a Linux server performance real-time monitoring tool with a cool interface and beautiful style. These two types of monitoring can greatly improve the performance of operation and maintenance work.

For more server performance and network monitoring commands and monitoring tools, here are:
- Summary of Linux system monitoring commands - master CPU, memory, disk IO, etc. to find performance bottlenecks
- Smokeping installation and configuration - free open source network performance monitoring tool visual master/slave deployment
- Server log analysis tools: ngxtop and GoAccess - real-time monitoring and visual management to quickly find the source of exceptions
1. Free open source PHP probe: x-prober
website:
- Project: https://github.com/kmvan/x-prober
- Download: https://api.inn-studio.com/download?id=xprober
- Demo: https://tz.inn-studio.com/
This is a PHP probe that can replace the Yahei probe. It has a beautiful interface, simple but practical functions, and is suitable for basic server probe needs. (Click to enlarge)
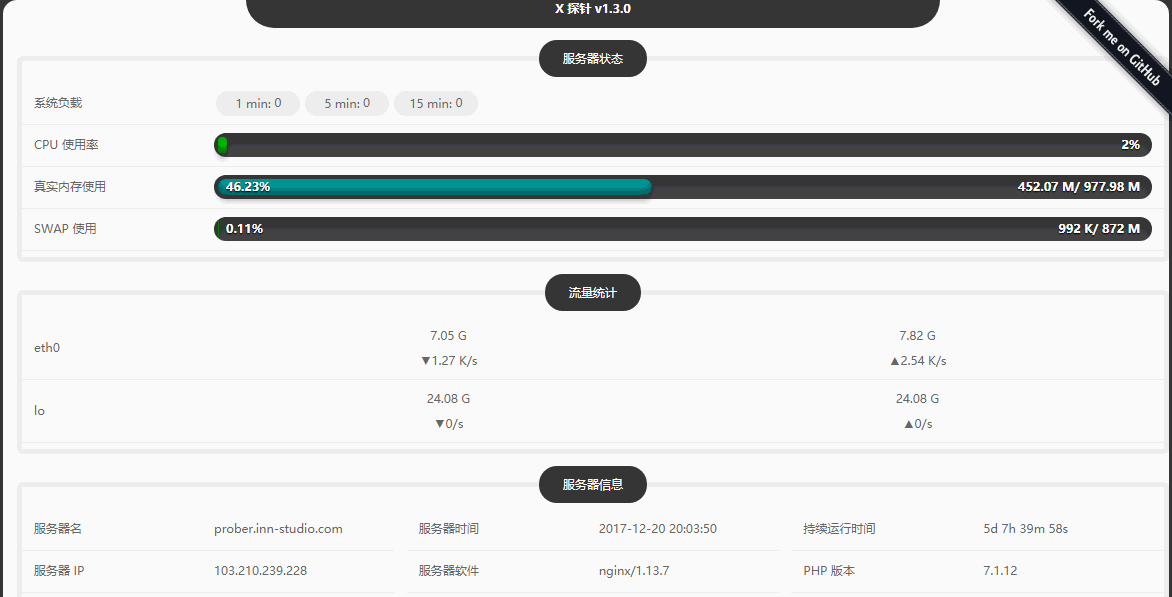
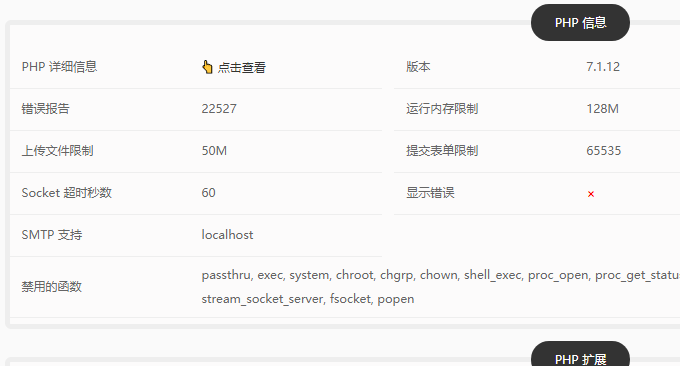
The x-prober probe can display server status, traffic statistics, server information, PHP information, PHP extensions, databases, server performance scores, etc.
2. Installation and use of Linux real-time monitoring tool Netdata
website:
- Official website: https://my-netdata.io/
- Demo: https://my-netdata.io/#demosites
- Home page: https://github.com/firehol/netdata
2.1 Netdata function introduction
Netdata is a Linux server performance monitoring tool with a very cool interface, very powerful functions, and very simple installation. It updates in real time, installs with one click, does not require any maintenance, and displays monitoring data directly in the browser. Netdata collects thousands of indicators per second, but only accounts for 1% of a single CPU core, a small amount of memory, and no disk IO reading and writing at all. As shown below: (click to enlarge)
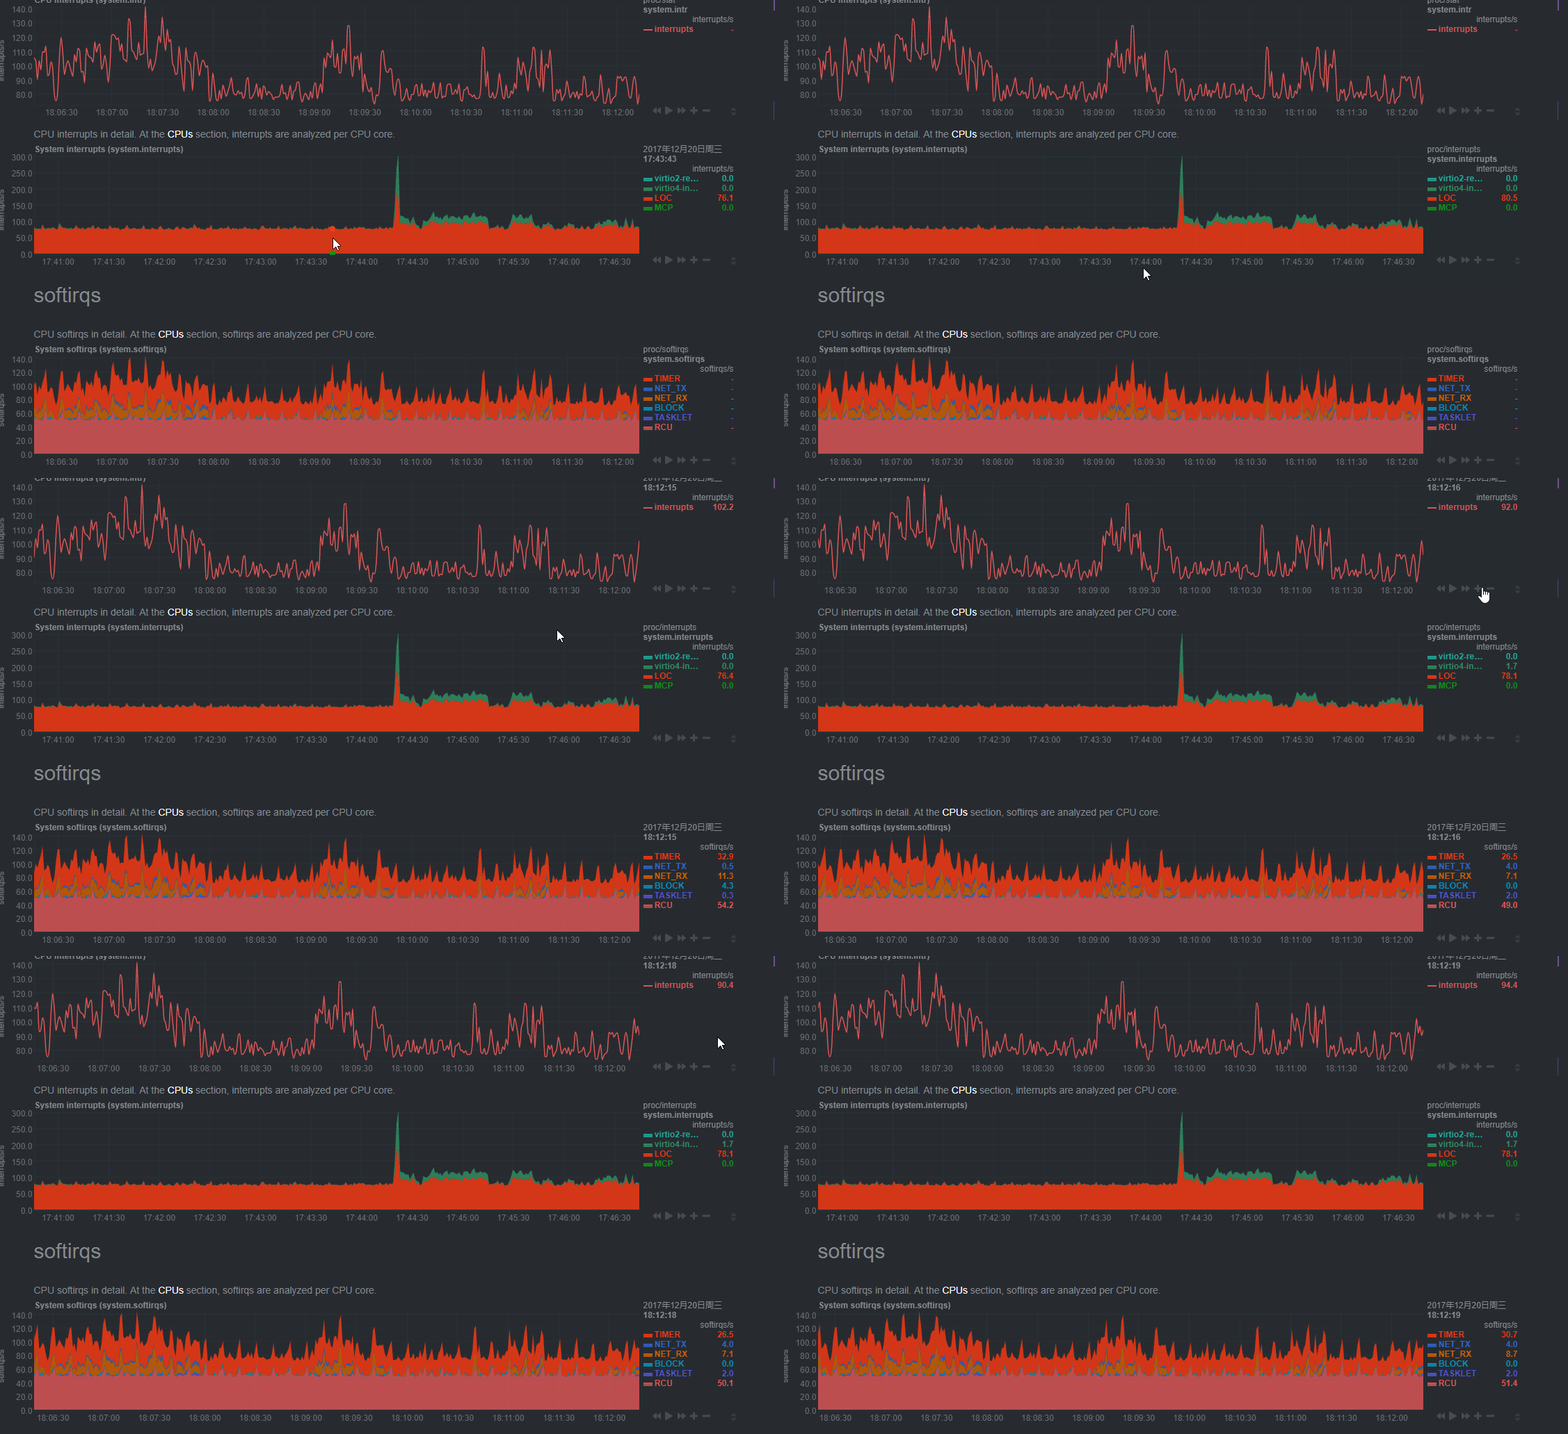
Netdata monitors a lot of content, mainly including:
CPU: usage, interrupts, softirqs, frequency, total and per-core CPU status
Memory: RAM, swap and kernel memory usage, KSM (kernel same page merging), NUMA
Disks: Per Disk: I/O, Operations, Backlog, Utilization, Space, Software RAID (md)
Network Interfaces: Per Interface: Bandwidth, Packets, Errors, Drops
IPv4 network, IPv6 network: bandwidth, packet, error, fragment, tcp: connection, packet, error, handshake, udp: packet, error, broadcast: bandwidth, packet, multicast: bandwidth, packet
netfilter/iptables Linux firewall: connections, connection tracker events, errors
NFS file servers and clients: NFS v2, v3, v4: I/O, caching, read-ahead, RPC calls
Apache and lighttpd web servers: mod-status (v2.2, v2.4) and cache log statistics for multiple servers
Nginx web server: stub state for multiple servers
Tomcat: access, threads, available memory, volumes
Web Server Log Files: Extract web server performance metrics in real time and apply multiple health checks
mySQL database: multiple servers, each server shows: bandwidth, queries/handlers, locks, issues, tmp operations, connections, binlog metrics, threads, innodb metrics and more
Postgres database: multiple servers, each server shows: per-database statistics (connections, read-write-tuples returned, transactions, locks), backend processes, indexes, tables, write-ahead, background writers, and more
Redis database: multiple servers, each server displays: operations, hit rate, memory, key, client, slave server
CouchDB: read/write, request methods, status codes, tasks, replication, per-db, etc.
memcached database: multiple servers, each server shows: bandwidth, connections, projects
NSD name servers: queries, zones, protocols, query types, transports, etc.
PowerDNS: queries, answers, caching, latency, and more
Postfix email server: message queue(entry, size)
NUT and APC uninterruptible power supplies: load, capacity, battery voltage, temperature, utility indicators, output indicators
PHP-FPM: multiple instances, each reporting connections, requests, performance
smartd: disk S.M.A.R.T. value
2.2 Netdata installation method
All Linux systems can use the following method to install netdata with one click (no need to use sudo):
# 基础安装
bash <(curl -Ss https://my-netdata.io/kickstart.sh)

# 或者

# 安装所有的组件
bash <(curl -Ss https://my-netdata.io/kickstart.sh) all
The directory structure of Netdata is as follows:
– the daemon at /usr/sbin/netdata
– config files in /etc/netdata
<x2 > – web files in /usr/share/netdata
– plugins < x2> in /usr/libexec/netdata
– cache files in /var/cache/netdata
< x2> – db files in /var/lib/netdata
– log files <x2 > in /var/log/netdata
– pid file at /var /run/netdata.pid
– logrotate file at /etc/logrotate.d/netdata
As shown below:

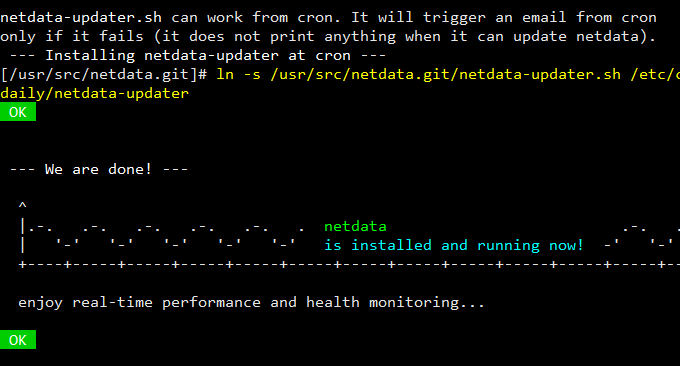
The following prompt indicates that Netdata has been successfully installed.
2.3 Netdata usage operations
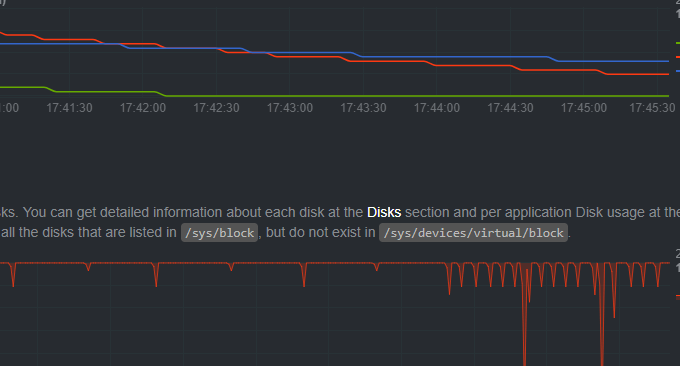
After installation, use ip:19999 to access it. This is the Netdata interface. It can be seen that it is very intuitive. Pull down the page to see various monitoring data. You can also quickly click on the corresponding indicators on the right to view it. (Click to enlarge)

Each monitoring data is updated in real time, and you can also click with the mouse to view details.
Netdata has an import and export function. You can export monitoring data for a certain period of time, and you can also import backup data.

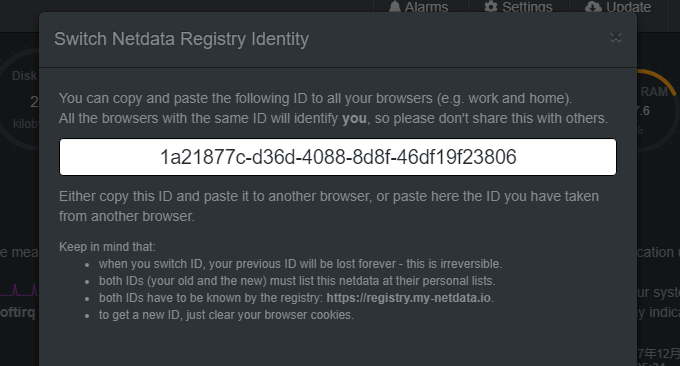
If you have installed multiple machines and want to access them through one browser, click my-netdata in the upper left corner. Then click on the three vertical bars icon.

Record the registration ID, and when you get home, enter and add each registration ID in your browser at home.

3. Summary
The biggest problem with Netdata monitoring is probably the language issue. Currently, the official website is only in English, and there are no other languages. If you think the English does not look good, you can manually translate it yourself. Web files are placed in this directory.
The x-prober probe is somewhat similar to the Yahei probe in terms of function. The main advantage is that it is much more beautiful and can be used as a substitute for the probe. Netdata can be used as an enterprise-level server monitor, but it is a bit "wasted" for personal use.
