
Statistical charts with numerical information play an important role on Internet web pages. In addition to the basic function of displaying numbers, people now pay more and more attention to the beauty and interactivity of these charts. As a result, programmers are facing more and more serious challenges. The process that most people imagine using drawing software to generate pictures and then putting them on web pages is unrealistic. Even though it may be beautiful in appearance, it is not easy to modify, purely static, and Disadvantages such as the inability to update in real time set the tone for it and cannot be used on a large scale! Nowadays, there are many various network programming languages, such as asp, php, .net... most of them have script drawing functions, but the functions are quite basic. They need to draw one graph after another, and need to calculate coordinates and other information. If you want it to be beautiful It's a bit difficult... The Jpgraph class library in php is a better table, but its dynamic beauty is still poor...
The birth of JQuery has brought light to the dynamic interaction design of web pages. Many emerging websites targeting young fashion groups have adopted JQuery technology. The most obvious ones are the easing, fade-in and fade-out effects of various modules on the web page. The development of technology has also brought great development to the display form of web statistical charts. The following introduces one of the relatively simple but also practical javascript libraries - Highcharts (statistical charts), Highstock (time series data display) , both are chart libraries written in pure JavaScript. They can easily and conveniently add interactive charts to web sites or web applications. They do not require plug-ins to run like Flash and Java, and they run quickly. , has good compatibility, can achieve adaptive size, and can perfectly support most current browsers, including IE6, which causes headaches for many front-end engineers. . And it is free for personal study, personal website and non-commercial use. The chart types currently supported by HighCharts include curve charts, area charts, bar charts, pie charts, scatter charts and comprehensive charts. Highstock is mainly used for time series data display.

Key features of HighCharts include:
1. Compatibility: HighCharts is written in pure JavaScript and is compatible with most of today's browsers, including iPhone, IE, Firefox, etc.;
2. Many chart types: HighCharts now supports a variety of chart types, including curve charts, area charts, bar charts, pie charts, scatter charts, comprehensive charts, etc., to meet various needs.
3. Not restricted by language: HighCharts can be used in most WEB development and is free for individual users. It supports use in multiple languages such as ASP, PHP, JAVA, .NET, etc.
4. Prompt function: In the chart generated by HighCharts, you can set the prompt effect to be displayed on the data point, that is, move the mouse to a certain data point, the detailed data of the point can be displayed, and the display effect can be set.
5. Magnification function: HighCharts can display a large amount of data in a centralized manner, and can enlarge a certain part of the graph to increase the accuracy of the chart and display it in detail. You can choose to zoom in horizontally or vertically.
6. Timeline: It can be accurate to milliseconds.
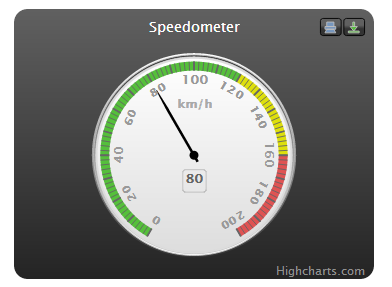
Chart example:


For all chart examples, please see the official demo: http://www.highcharts.com/demo/ http://www.highcharts.com/stock/demo/
It is very convenient to call these two types of js library charts. According to the official template, insert the required js code and referenced js files into the page, and use the unique id value in the div layer area where the chart is inserted.
Text modifications on charts:
chart: {
        renderTo: 'container',
        type: 'line'
    },
    title: {
        text: 'Monthly Average Temperature'
    },
    subtitle: {
        text: 'Source: WorldClimate.com'
    },
    xAxis: {
        categories: ['Jan', 'Feb', 'Mar', 'Apr', 'May', 'Jun', 'Jul', 'Aug', 'Sep', 'Oct', 'Nov', 'Dec']
    },
    yAxis: {
        title: {
            text: 'Temperature (°C)'
        }
Data source changes in charts are roughly divided into three situations:
1. The simplest, use text replacement directly on the page
series: [{
    name: 'USA',
    data: [null, null, null, null, null, 6 , 11, 32, 110, 235, 369, 640,
        1005, 1436, 2063, 3057, 4618, 6444, 9822, 15468, 20434, 24126,
        27387, 29459, 31056, 31982, 32040, 31233, 29224, 27342, 26662,
        26956, 27912, 28999, 28965, 27826, 25579, 25722, 24826, 24605,
        24304, 23464, 23708, 24099, 24357, 24237, 24401, 24344, 23586,
        22380, 21004, 17287, 14747, 13076, 12555, 12144, 11009, 10950,
        10871, 10824, 10577, 10527, 10475, 10421, 10358, 10295, 10104 ]
}, {
    name: 'USSR/Russia',
    data: [null, null, null, null, null, null, null , null , null ,null,
    5, 25, 50, 120, 150, 200, 426, 660, 869, 1060, 1605, 2471, 3322,
    4238, 5221, 6129, 7089, 8339, 9399, 10538, 11643, 13092, 14478,
    15915, 17385, 19055, 21205, 23044, 25393, 27935, 30062, 32049,
    33952, 35804, 37431, 39197, 45000, 43000, 41000, 39000, 37000,
    35000, 33000, 31000, 29000, 27000, 25000, 24000, 23000, 22000,
    21000, 20000, 19000, 18000, 18000, 17000, 16000]
}]
2. Call a text file in a specific format:
jQuery.get('analytics.tsv', null, function(tsv, state, xhr)Take this as an example. Use text editing software to open the analytics.tsv file and you can see the data structure. Just generate new data and replace it according to the original structure.
3. In Highstock time series type charts, remote file calling is mostly used:
$.getJSON('http://www.highcharts.com/samples/data/jsonp.php?filename=usdeur.json&callback=?', function(data)You can also open the sample file http://www.highcharts.com/samples/data/jsonp.php?filename=usdeur.json&callback=?,
?([
[Date.UTC(2003,8,24),0.8709],
[Date.UTC(2003,8,25),0.872],
[Date.UTC(2003,8,26),0.8714],
[Date.UTC(2003,8,29),0.8638],
[Date.UTC(2003,8,30),0.8567],
[Date.UTC(2003,9,1),0.8536],
[Date.UTC(2003,9,2),0.8564],
[Date.UTC(2003,9,3),0.8639],
[Date.UTC(2003,9,6),0.8538],
[Date.UTC(2003,9,7),0.8489],
[Date.UTC(2003,9,8),0.8459],
[Date.UTC(2003,9,9),0.8521],
[Date.UTC(2003,9,10),0.8477],
…………
Imitation by structure.
For those who have a good javascript foundation, they are not limited to the given data calling method and can be adjusted flexibly. For a novice level, just imitate according to the data structure. Pay attention to the structural format of the data file and the special marks at the beginning and end of the file. If the marks are lost, the data may not be read and the charts cannot be displayed.
The use of data sources can completely use scripting languages such as php to read from the database to achieve real-time updates. At the same time, for more complex display projects, multi-module combinations can also be used to combine a web page into a display system.