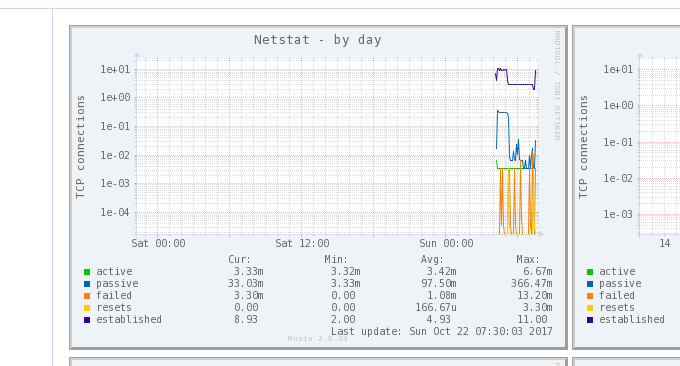
Last time, a friend raised a question about the storage of English picture sites in the website digging forum. There was a sentence in the description of the problem that particularly impressed me - " I do not recommend VPS bare metal to novices, even if you are proficient. If you use WP to build a website, you may not be able to handle server management. " I actually heard this sentence when I first started building a website, so I took a lot of detours and suffered a lot of "dumb losses." .
For pictures, film and television websites with large traffic and large storage, as well as blog websites with large traffic, VPS hosting or even independent servers are naturally the best. Firstly, they can save costs, and secondly, they can share risks. As for the issue of server maintenance, as long as the Web environment is set up in the early stage, later maintenance is not "difficult to do" as others say. Just learn more and master a few more commands.
This article will share the steps that webmasters should take when abnormal server traffic occurs. Whether the website encounters abnormal traffic and slow website opening, it can be basically boiled down to three types: One is that the website is suffering DD or CC attack; one is that the server memory or CPU is exhausted; the last one is that the server is "mounted".

Learning the commands to check server bandwidth abnormalities can help us quickly locate the problem and find out the "Li Gui" behind it. More basic Linux server command usage includes:
- Linux Crontab command scheduled task basic syntax and operation tutorial-VPS/Server Automation
- Summary of Linux system monitoring commands - master CPU, memory, disk IO, etc. to find performance bottlenecks
- Three command tools Rsync, SCP, and Tar-quick solution to VPS remote website relocation and data synchronization
PS: Updated on February 22, 2019, If it is determined that the abnormal traffic is caused by CC and DDos attacks, the following ideas can be adopted to solve the problem: Basic ideas for VPS host attack defense against CC and DDOS - Anti-scan firewall blocking policy.
1. Step 1: Check the overall bandwidth usage
Basic command installation and usage:
nload:
yum install nloadorsudo apt-get install nload, usage:nloadornload -u Mbmon:
sudo yum install bmonorsudo apt-get install bmon, usage:bmonbwm-ng:
sudo apt-get install bwm-ngorsudo yum install bwm-ng, usage:bwm-ngcbm:
sudo apt-get install cbmorsudo yum install cbm, usage:cbmspeedometer:
apt-get install speedometerorsudo yum install speedometer, usage:speedometernetload:
sudo apt-get install netloadorsudo yum install netload, usage:netload
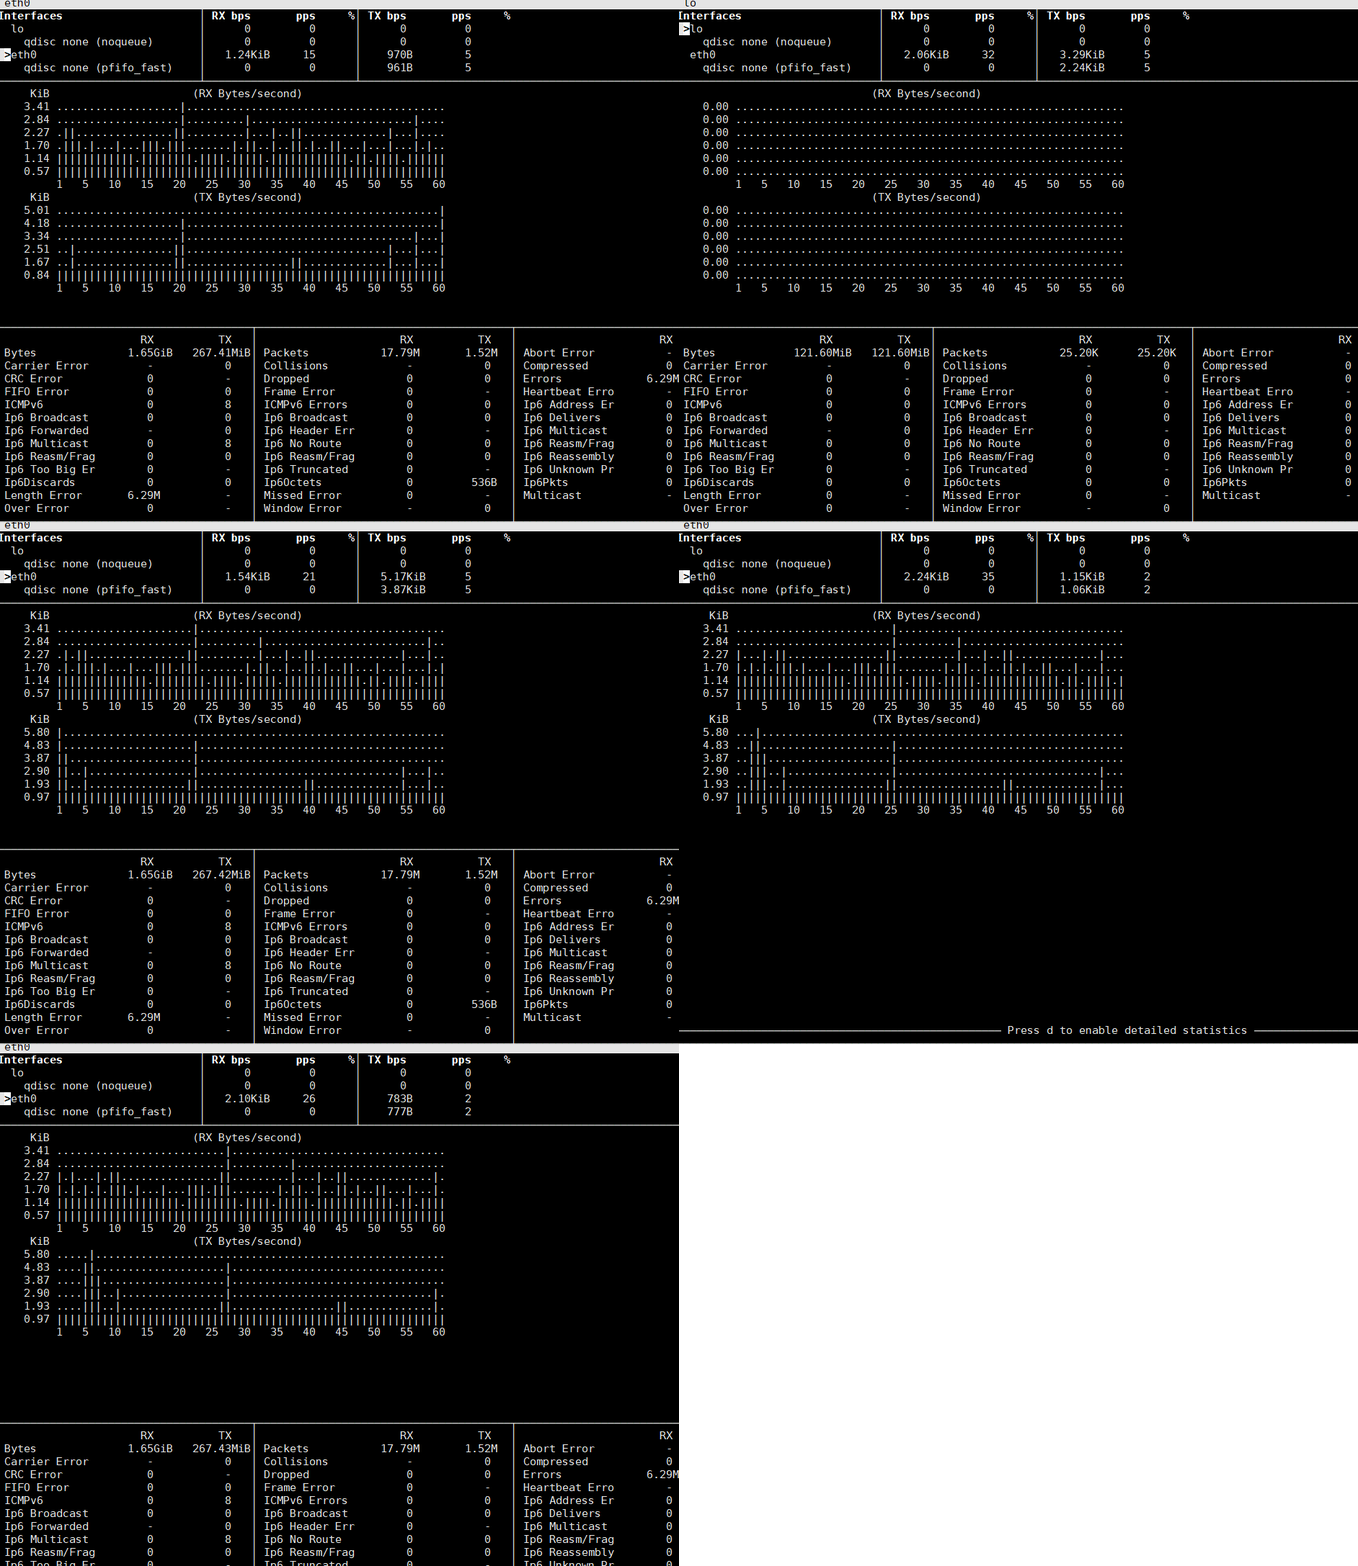
If you find that access to your VPS host becomes abnormally slow, you can check whether the bandwidth is occupied and exhausted. The above command can monitor the overall network traffic and bandwidth usage, and can provide information such as the total amount of data exchanged and the minimum/maximum network bandwidth. Additional information such as usage. This is a bmon command demonstration: (click to enlarge)
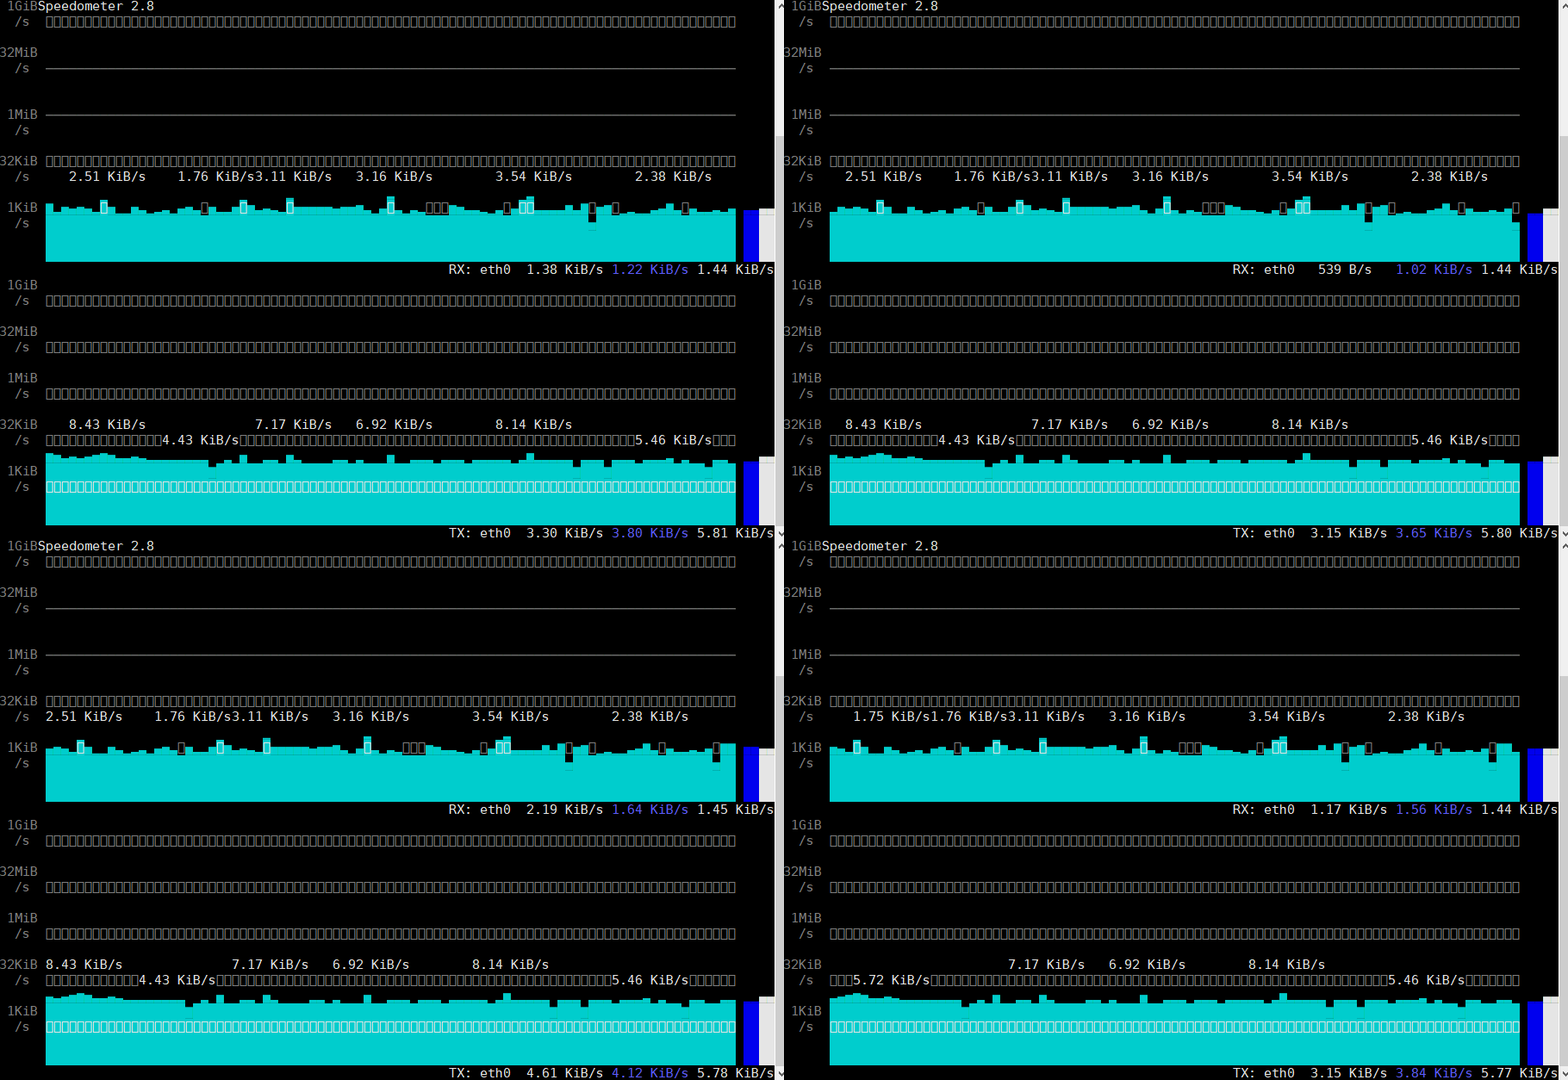
This is a speedometer operation demonstration. You can see the real-time bandwidth trend. If you find bandwidth abnormalities, you can see detailed data here. (Click to enlarge)
2. Step 2: View the traffic transmission of each connection
Basic command installation and usage:
iftop:
yum install iftoporapt-get install iftop, usage:iftopiptraf:
yum install iptraforapt-get install iptraf, usage:iptraftcptrack:
yum install tcptrackorapt-get install tcptrack, usage:tcptrackpktstat:
yum install pktstatorapt-get install pktstat, usage:pktstatnetwatch:
yum install netwatchorapt-get install netwatch, usage:netwatchtrafshow:
yum install trafshoworapt-get install trafshow, usage:trafshow
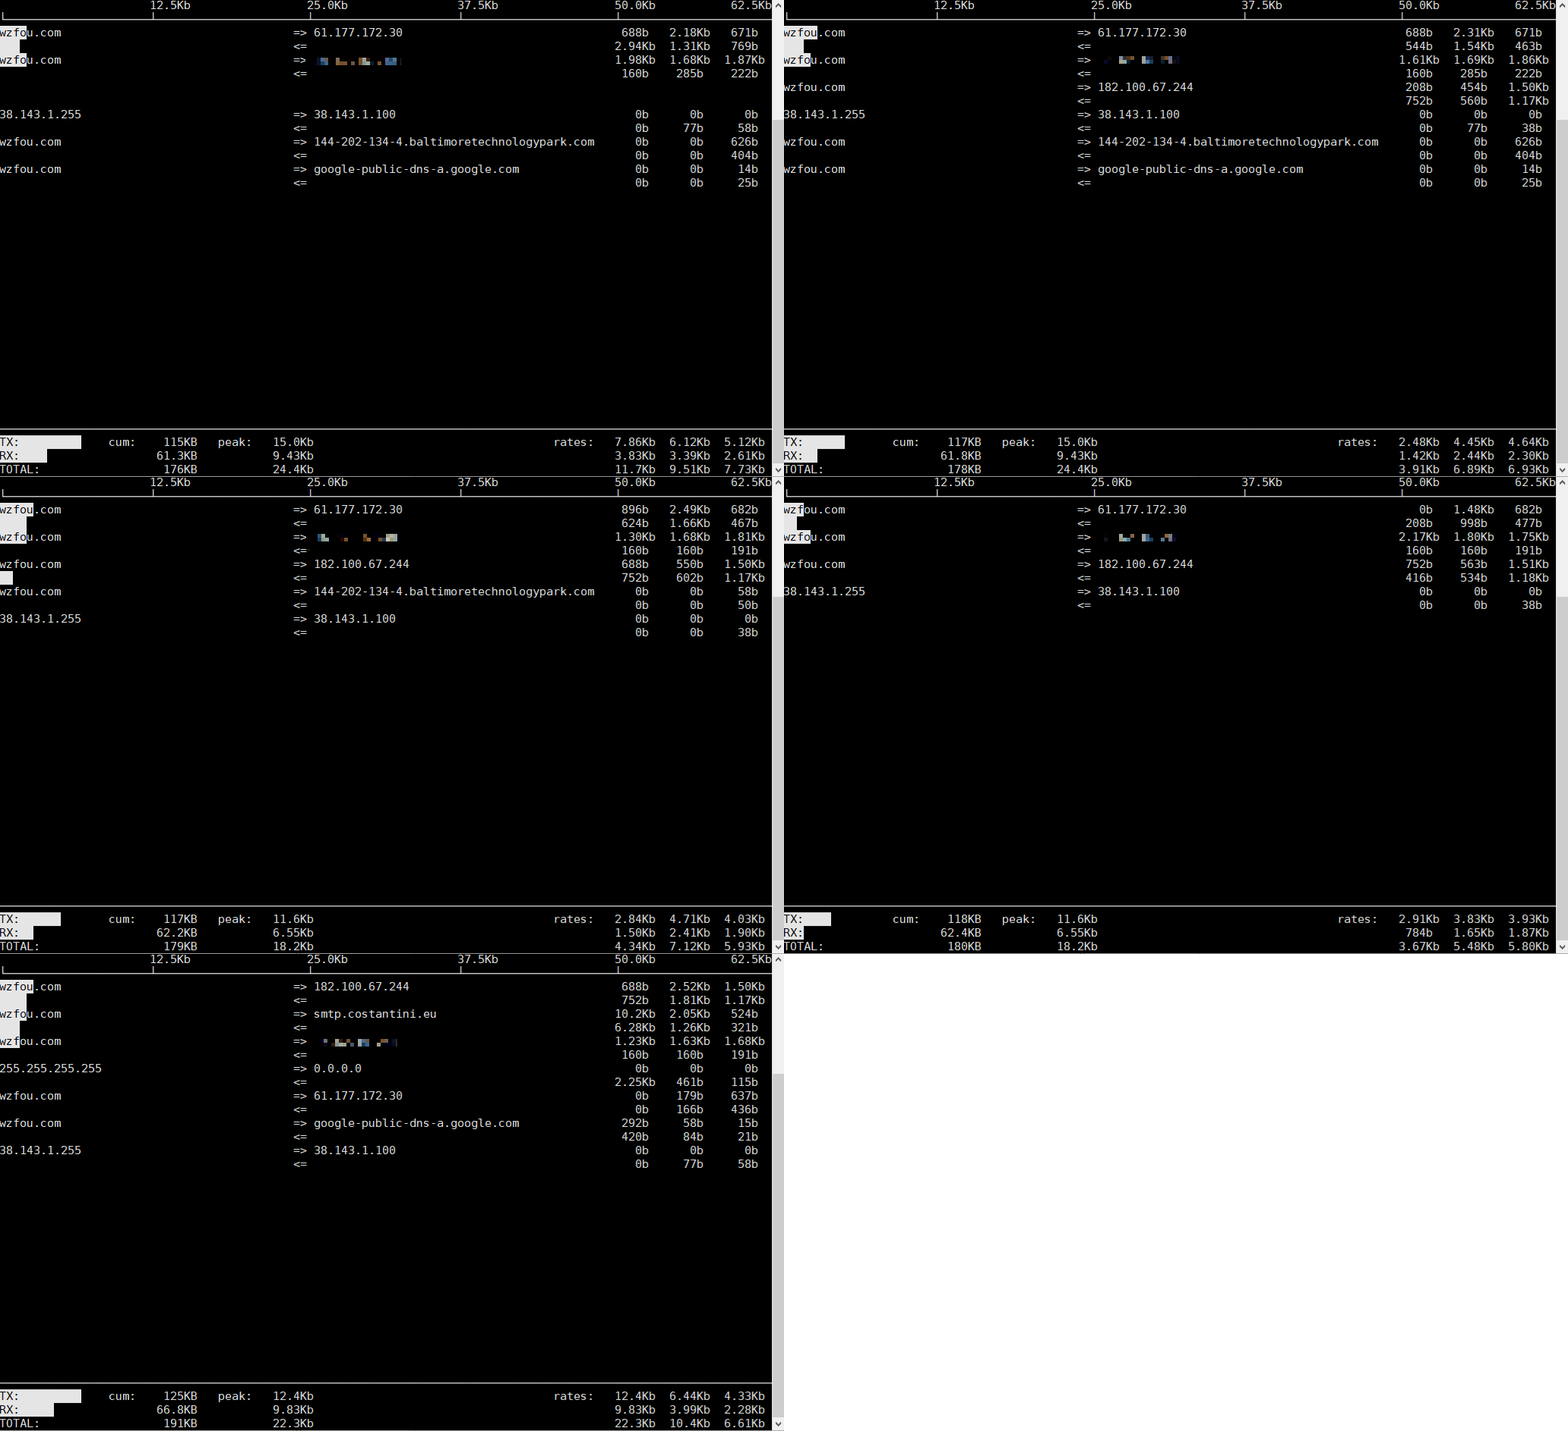
This is the iftop command to check the bandwidth usage of each connection on the VPS host. Here you can see the specific IP connection status. Generally speaking, the IP used for attacks will generate very large traffic. You can use this method to find abnormal IPs. .
3. Step 3: View the data transmission of each process
Basic command installation and usage:
nethogs:
yum install nethogsorsudo apt-get install nethogs, usage:sudo nethogs
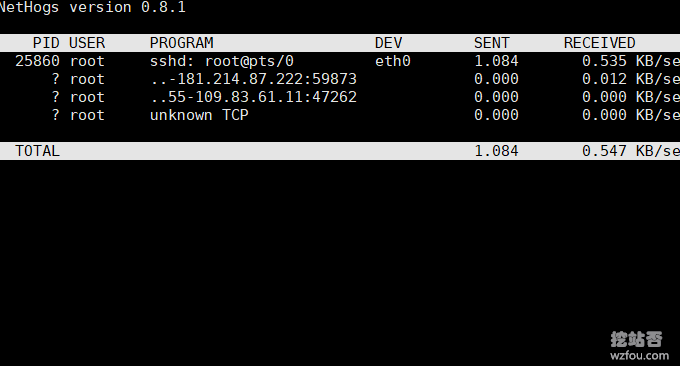
NetHogs is used to collect real-time statistics on network bandwidth usage by process or program. The send column and received column display the traffic statistics according to each process, and the total sending and receiving data bandwidth is at the bottom. As shown below:
4. Summary
The above commands are all commands that come with Linux. You can directly use the yum or apt installation method to install. The usage is the same. You can start it by directly entering the command. By checking the three steps of total bandwidth, single connection traffic transmission and single process data transmission, the problem can basically be located.
If you think the command is too simple and want a more comprehensive and sustainable Linux server traffic and bandwidth statistics, it is recommended to use Ntopng and Munin, which come with their own web panels and can be viewed directly with a browser: two excellent server network traffic monitoring Tools: Ntopng and Munin - Powerful and intuitive.
