
Correlation analysis is one of the important components in the data mining system, and its representative case is "shopping basket analysis". Let's take the shopping basket analysis data provided by the data mining software Clementine as an example to explore this aspect from multiple aspects.
The main problem to be solved by correlation analysis is: after a group of users purchase many products, which products are more likely to be purchased at the same time? Which product is more likely to be purchased together with product A? Perhaps because correlation analysis was initially widely used in supermarkets, it is also called "shopping basket analysis", or MBA in English. Of course, this MBA is not the other MBA, which means Market Basket Analysis.
If in the research question, all the products purchased by a user are assumed to be purchased at one time at the same time, the focus of the analysis is the correlation between the products purchased by all users; if it is assumed that the products purchased by a user are purchased at different times, and the analysis It is necessary to highlight the relationship in time order, such as what was bought first, and what was bought later? Then this type of problem is called a sequence problem, which is a special case of correlation problem. In a sense, sequence problems can also be operated in terms of association problems.
There are three very important concepts in correlation analysis, which are the "three degrees": support, credibility, and promotion. Suppose 10,000 people buy products, of which 1,000 people buy product A, 2,000 people buy product B, and 800 people buy product A at the same time. Support refers to the proportion of the number of people who purchase related products (assuming that product A and product B are related) at the same time to the total number of people, that is, 800/10000=8%, and 8% of users purchased both products A and B at the same time; Credibility refers to the possibility of purchasing another product after purchasing one product. For example, the credibility of purchasing product B after purchasing product A = 800/1000 = 80%, that is, 80% of users purchase product A after purchasing product A. After the product, product B will be purchased; the promotion degree is the ratio of the possibility of purchasing product B under the condition of purchasing product A to the possibility of purchasing product B without such conditions. The possibility of purchasing product B without any conditions = 2000/10000 =20%, then the improvement degree=80%/20%=4. (http://bai.zhihao.blog.163.com/blog/static/5652272320118953220582/)
The most classic case of correlation analysis is the story of Walmart’s beer and diapers:
When Wal-Mart's supermarket managers analyzed sales data, they discovered an incomprehensible phenomenon: Under certain circumstances, two seemingly unrelated items, beer and diapers, would often appear in the same shopping basket. It turns out that when young fathers go to the supermarket to buy diapers, they often buy beer for themselves.
Wal-Mart discovered this unique phenomenon and began to try to place beer and diapers in the same area in its stores, so that young fathers can find these two items at the same time and complete their shopping quickly. Wal-Mart Supermarket can also allow these customers to purchase two items at a time instead of one, thus gaining more sales revenue. It reveals to us that products are related. By discovering and utilizing the related relationships between these products, we can achieve the purpose of increasing sales by increasing the number of products in the shopping basket without significantly increasing the number of customers in the store. , thereby obtaining greater operating income.
Commodity correlation means that commodities are not isolated in the store. Different commodities will form a mutual influence relationship during sales. Since this relationship is often hidden behind a large number of commodity groups, we cannot usually find it, so it is also called commodity correlation. "secret love relationship" between them.
So how do we make "secret relationships" public? The method of discovering the relationships between products is called shopping basket analysis. For the traditional retail industry, in order to analyze the shopping basket of goods, certain data analysis methods are required.
First, we use customer shopping data collected by POS machines to find out which products often appear in the same shopping basket. If you find that the probability of beer and diapers appearing in the same shopping basket is relatively high, you can think that there is a relationship between beer and diapers. This can prompt store managers to display beer and diapers, two seemingly incompatible products, together, or bundle them together for promotion, so that this "secret love relationship" can play a role in promoting sales and make the "secret love relationship" "Be public. ("Beer and Diapers")
Our data includes these things:
Shopping basket summary:
• cardid. The loyalty card identifier of the customer who purchased this basket of items.
• value. The total purchase price of the shopping basket.
• pmethod. The payment method for the shopping basket.
Card holder’s personal details:
• sex
• homeown. Whether the card holder owns a home.
• income
•age
Shopping basket content - the appearance mark of the product category. In the data, T means purchased and F means not purchased:
• fruitveg
• freshmeat
•dairy
•cannedveg
•cannedmeat
• frozenmeal
• beer
•wine
•softdrink
• fish
• confectionery
Using Clementine's web network mapping function, you can get the following results:

After adjusting the relationship strength display, three commodity groups can be clearly obtained, which can be understood to mean that consumers purchase more products from group combinations, that is, they purchase products within the same group at the same time.
This is the result obtained using the GRI correlation model:

The results are basically consistent with those observed in the network diagram.
Using data mining technology, we can also use C5.0 and other related algorithms to model the same problem at this time, and conduct subjective evaluation and objective accuracy verification of the modeling results. At the same time, we can filter out the purchasing consumers of the three product groups and continue to use the correlation analysis method to examine the impact of demographic variables on the product groups, thereby determining which group of people prefers to buy which products at the same time, and improve product sales. provide support.
Below, we ignore the actual significance of this data and only consider the classification of several variables. We no longer consider the suitability of practical problems and statistical methods. We only look at the data structure and use traditional statistical data analysis methods. Can we still To draw these conclusions?
Import the data into SPSS and recode the data. The original T and F are replaced with numbers 1 and 0, because 1 and 0 are numbers that can be operated on and can participate in a variety of mathematical modeling.
The results of relevant analysis:

Clustering results:

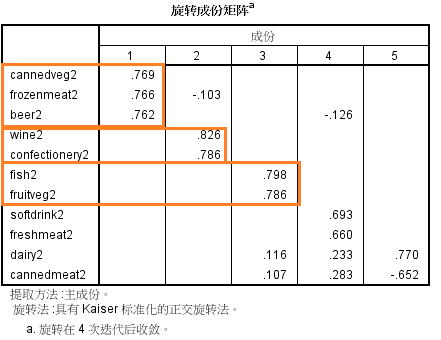
The results of factor analysis:

All conclusions are very consistent!